Deviations
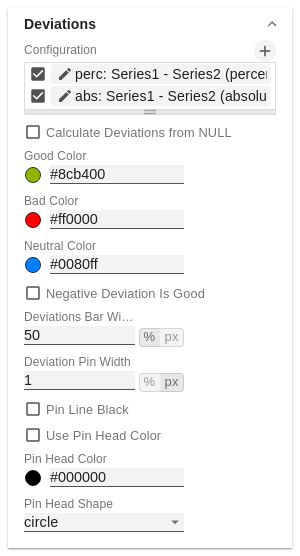
Configuration
Über das +-Zeichen legen Sie Abweichungen (Deviation) an, die oberhalb des Grunddiagramms gezeigt werden. Zum Entfernen einer Abweichung klicken Sie den roten Mülleimer. Standardmäßig werden eine absolute und eine prozentuale Abweichung dargestellt. Die Checkbox (de-)aktiviert die Sichtbarkeit einer AbweichungUse the + sign to create deviations, which are shown above the basic diagram. To remove a deviation, click the red trash can. By default, an absolute and a percentage deviation are shown. The checkbox (de)activates the visibility of a deviation.
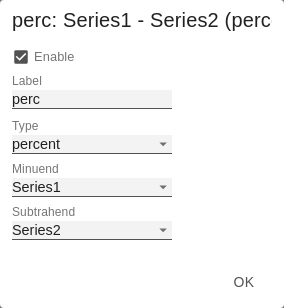
Configuration Pop-Up
Die Checkbox Enabled setzt die Sichtbarkeit der gewählten AbweichungThe checkbox Enabled sets the visibility of the selected deviation.
- Label: Benennen Sie hier die Abweichung Name the deviation.
- Type: Wählen Sie zwischen absoluter (absolute) oder prozentualer (percent) Abweichung Choose between absolute or percentage deviation.
- Base Index: Der Wert, der als Bezugsgröße verwendet werden soll The value to be used as a reference value.
- Reference Index: Der Wert, der überprüft wird, inwieweit er von der Bezugsgröße abweicht The value that is checked to see how far it deviates from the reference value.
| Info |
|---|
RechengangCalculation: AbsolutAbsolute: Reference Index - Base Index ProzentualPercentage: (Reference Index - Base Index) / |Base Index)| |
Die Reihenfolge der Anzeige diese Abweichungsachsen entspricht der Reihenfolge in der The order in which these deviation axes are displayed corresponds to the order in the Deviations Configuration.
Calculate Deviations from NULL
Gibt an, ob Abweichungen auch aus NULL-Werten berechnet werden sollen. Specifies whether deviations should also be calculated from NULL values.
Good / Bad / Neutral Color
Definieren Sie an dieser Stelle mit welcher Farbe positiv At this point, define the color with which positive (Good), negativ negative (Bad) oder neutrale or neutral (Neutral) Abweichungen dargestellt werden deviations are displayed.
Negative Deviation Is Good
Diese Option invertiert das Farbschema für die Farben der Abweichung. Beispielsweise können so negative Werte mit grüner Farbe dargestellt werden, bei Verwendung der AusgangsfarbenThis option inverts the color scheme for the colors of the deviation. For example, negative values can be displayed with green color when using the original colors.
Pin Line Black
Diese Option färbt die Linie der Nadel im Abweichungsdiagramm schwarzThis option colors the needle line in the deviation graph black.
Deviation Bar Width for Scenarios
Bar width greift dann auf die absolut Deviation (dafür muss die Option 'Scenarios in Deviation Data Tab aktiviert sein)'
Use Pin Head Color
(De)aktiviert die ausgewählte activates the selected Pin Head Color. Bei Deaktivierung werden die hinterlegten Farbwerte der Abweichungen angewendet (standardmäßig: grün/rotIf deactivated, the stored color values of the deviations are applied (default: green/red)
Pin Head Color
Die Kopffarbe der Nadel im prozentualen Abweichungsdiagramm. Die Farbe wird nicht auf die Nadelköpfe des Basisdiagramms angewendetThe head color of the needle in the percentage deviation diagram. The color is not applied to the needle heads in the base chart.