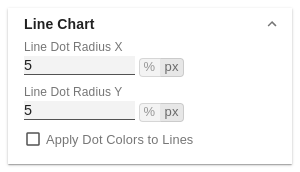
Line Chart
Line Dot Radius X
Specify the X-radius in the line chart. The input value can be interpreted as a percentage or absolute value.
Line Dot Radius Y
Specify the Y-radius in the line chart. The input value can be interpreted as a percentage or absolute value.
Line Dot Shape
Select which shape in the line chart is used for a data point. The following options are available:
- circle
- rect
- rhomb
- triangle
- wedge
- none
| Info |
|---|
By differentiating between X and Y, ellipses and the like can also be implemented. |