Display Elements
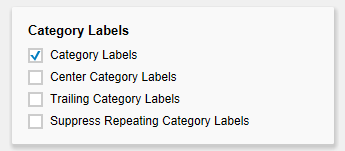
This section controls the labels of the bullet graphs. If the first checkbox is activated, the category labels are displayed for each bullet graph.
If the second checkbox is activated, repeating category labels will be suppressed.
If the third checkbox is activated, tooltips with detailed information will be displayed while hovering over the bullet graph elements during runtime.
If the option Performance Values is activated the values of the Performance Measure 1 are displayed at the end of the corresponding bar. All other values can be seen by using the Tooltips.
...
...
Comparison Group
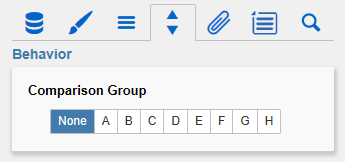
Several bullet graph components can be scaled identically by using the same Comparison Group, which is activated by the checkbox. The comparison group will then be shown during design time on the top right corner of the component. That way the minimum and maximum of the data basis in this group is used.
Comparison groups are used globally within the BIApp, ie also graphomate charts, graphomate tiles as well as deviation charts in the graphomate tables are scaled identically by using the same comparison group abbreviation.
Reverse Qualitative Ranges
This checkbox controls the display of the Qualitative Ranges. If this option is deselected, they are drawn from the left side (usually the value range minimum) to the input value (or calculated value). If the option is activated, the Qualitative Ranges are displayed in reverse so that the range is drawn from the input value to the value range maximum.
Reverse Quantitative Ranges
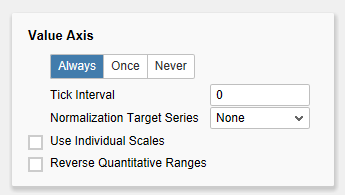
This checkbox controls the representation of the axis. If this option is activated, the axis is drawn from n to 0, otherwise the scaling is inverted – from 0 to n.
...
...


