You have defined a Data Source on basis of a SAP BW Query and now want to depict Data Series from this query with graphomate charts.
- Drag the component graphomate charts to the canvas and bind the Data Source to this component via drag&drop.
- Select the Chart Type and the deviations that you need on the tab General Start.
The Checkboxes next to the chart types and in front of the chosen deviations representations and other UI-elements give you the opportunity to control the visibility of these elements in the chart.
Center 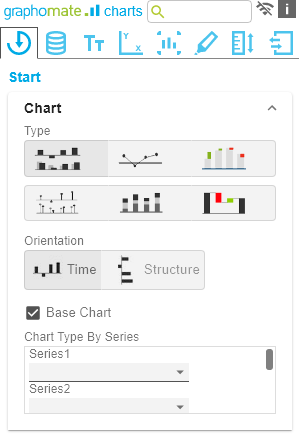

On the Data tab select the
DataSeries from the Query in the Initial view – in rows or columns – which you want to show by clicking the corresponding
button
Data button. Just click on the row or column header or select a range with the Ctrl key pressed. The selected
 Series is highlighted in blue and after clicking OK
it, it will be shown in the chart.
Center 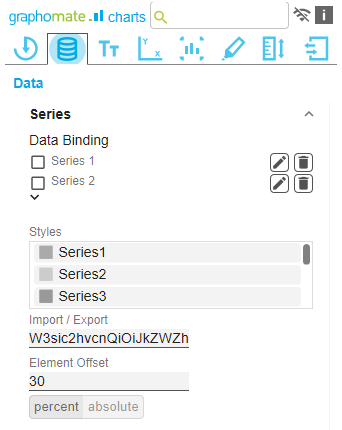
the Initial View of theInfo We recommend hiding the totals of the dimension in
withthe Initial View of the Data Source
>with a right mouse click
>> Total Display
> Hide Totals.
- The category labels are captured automatically from the meta data of the selected Data Series.
- Please refer to the steps above for selecting another Data Series
(
).
This Videovideo on youtube gives YouTube gives you a step-by-step description in just three minutes.