Waterfall
CalcutionCalculation Path
A waterfall chart – often also called a flying bricks chart – shows how an initial value is increased (inflow) or decreased (outflow) by a series of values, which lead to a final value – if necessary with subtotals and spans.

| Center |
|---|
For a flexible use of the waterfall in in graphomate charts an additional an additional Data Series has has to be defined: the the Waterfall Calculation Path. This This Data Seriesdetermines determines, whether the value to be shown is an in- or an outflow value, a (sub-)total or a span.In In general, the sign of the data series value determines determines the effect on the (sub-) totals of the waterfall:- negative . Negative values are interpreted as outflow values,+ positive positive values are interpreted as inflow valuesand values and colored according to the color scheme on the the Appearance tab tab.Please note that in
| Info |
|---|
In case of |
using Data Types |
the colors of |
the Data Types |
overwrite the color scheme of |
the Appearance |
tab. |
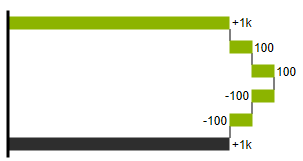
By default, the last element of a waterfall is interpreted as the sum total. A waterfall without entries in the waterfall without entries in the Waterfall Calculation Path would would therefore look like this:

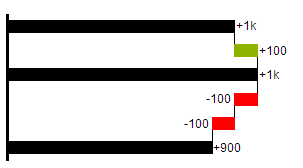
. By defining the Waterfall Calculation Path
thethe appearance and the sign of each waterfall element can be controlled independently - even via scripting language. The following options can be used:
| Center |
|---|
|

+ = inflow
Positive signs are suppressed, the (+)the ![]() -color is applied to the elements.
-color is applied to the elements.

- =
| Center |
|---|
|
-=outflow
Negative signs are suppressed, the (the ![]() -)-color is applied to the elements.
-)-color is applied to the elements.

| Center |
|---|
|

0 = neutral position
All signs are shown, the (0)-color is applied to the elements.

| Center |
|---|
|

==(Sub-)total
The element starts at the value axis and the (=)-color is applied to those elements.

| Center |
|---|
|
s-=
outflow span
With the help of a span single changes can be
summarized starting from a (sub-)total.
With an outflow span single cost items can be aggregated to a total cost.
Corresponding to outflow elements (see above) negative signs are suppressed and the (s-)-color is applied to the elements.

| Center |
|---|
|

s+=
inflow span
With an inflow span single inflow items can be aggregated starting from a (sub-)total.
Corresponding to inflow elements (see above) positive signs are suppressed and the (s+)-color is applied to the elements.

Please note:
The
| Center |
|---|
|

| Info |
|---|
The (-) and (s-) |
values in |
the Waterfall Calculation |
Path also have an effect on the corresponding deviation charts: For negative values, which are now shown without signs based on |
the (-) and (s |
)-entries, the sign and the orientation of the deviation is reversed by necessity. Otherwise there is a risk of misinterpretation. |

