Pictogram
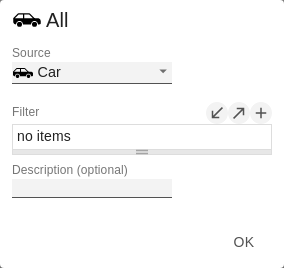
Icon Definitions
Each entry represents an icon definition. This consists of the attributes Source and Filter as well as Description. Under Source you can select the source for an icon. In addition to preselected icons1) , you can provide your own icon under the Custom entry. This can be a valid URL or data URL. The most common image formats (.svg, .png, .jpeg and .gif) are supported. For performance reasons, the selected image files should not be too large (ideally only a few kilobytes), since they must either be loaded via external requests or, in the case of a data URL, included in the source code.
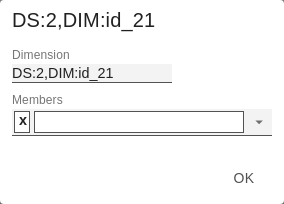
Under Filter, select the dimension and the associated members for which the icon is to be drawn. If you do not set a filter, the icon is applied to all data points, since there is no restriction. If there is an overlap between icon definitions regarding dimensions and members, the last created icon definition has priority.
The Description option allows you to define your own description for the icon definition, which then appears together with the selected icon in the list of created icon definitions. If no Description is set, the selected dimension members are displayed next to the icon (if there is no restriction, All is displayed).
1)It is recommended to use the structural mode for the pre-selected icons.
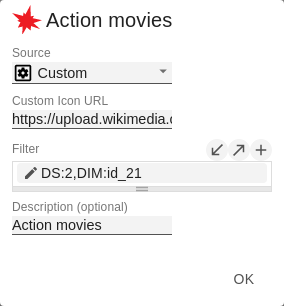
Icon Definition Custom Icon URL
If the option 'Custom' is set in the Icon Definition under Source, an additional text field appears with the title Custom Icon Url. There are two ways to provide your own icon:
1) Img-URl: Geben Sie eine externe URL an, unter der das Icon gespeichert ist.
2. Data ) Data URL: With the help of a Data URL external sources can be directly integrated into html. In order for the image to be used in the pictograms, the data-url must be specified in the following format: data:[<MIME-Type>];base64,<Data>
| Info |
|---|
Representation of a red dot: "data:image/png;base64,
iVBORw0KGgoAAAANSUhEUgAAAAoAAAAKCAYAAACNMs+9AAAABGdBTUEAALGP
C/xhBQAAAAlwSFlzAAALEwAACxMBAJqcGAAAAAd0SU1FB9YGARc5KB0XV+IA
AAAddEVYdENvbW1lbnQAQ3JlYXRlZCB3aXRoIFRoZSBHSU1Q72QlbgAAAF1J
REFUGNO9zL0NglAAxPEfdLTs4BZM4DIO4C7OwQg2JoQ9LE1exdlYvBBeZ7jq
ch9//q1uH4TLzw4d6+ErXMMcXuHWxId3KOETnnXXV6MJpcq2MLaI97CER3N0
vr4MkhoXe0rZigAAAABJRU5ErkJggg==" |
The expression data: indicates that the URL is a data URL. The MIME type (in the example: image/png) defines the type of content ;base64 specifies the encoding of the data. After a ", " (comma) follows the actual image as base-64 encoded string. Under the Google search 'data-url generator' you can find various online services that encode image files as base64 encoded strings and then provide them as data URLs.
| Info |
|---|
Tip: Office Microsoft 365 contains an extensive collection of categorized pictograms that can be saved locally as vector graphics (svg). |
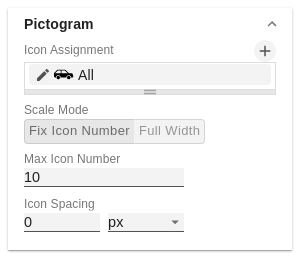
Scale Mode
Determines the scaling mode for the pictograms.
Fix Icon Number(Default): Space is reserved for n (given by the Property Max Icon Number) icons, regardless of whether n icons are actually needed to display the maximum value. This scaling mode is recommended if the values can change dynamically over several orders of magnitude (e.g. during filtering), since the size of the icons does not change.
Full Width: The space reserved for the icons depends on the number of icons needed to display the maximum value. The required number is always less than or equal to the value from the property Max Icon Number. This mode is more suitable for static representations and uses the full width for the representation of the icons.
Note: The size of the square icons is exclusively based on the given width in both the temporal and structural representation of the pictograms.
Max Icon Number
Determine the maximum number of icons per data point. This affects the value that the icon represents. The system tries to find a value for each icon that makes the most sense so that the actual maximum number of icons is less than or equal to the number you specify.
Icon Spacing
Defines the distance between two icons (within a data point). Select a CSS unit from the list (such as px,em).
