| Excerpt | |||||||||||||||||||||||||||||||||||||||
|---|---|---|---|---|---|---|---|---|---|---|---|---|---|---|---|---|---|---|---|---|---|---|---|---|---|---|---|---|---|---|---|---|---|---|---|---|---|---|---|
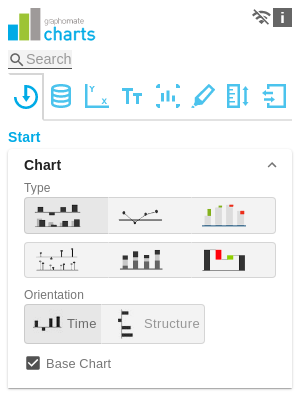
horizontal für Entwicklungen über die Zeit
Sie wählen den gewünschten Diagrammtyp durch Klick auf das entsprechende Icon. OrientationAlle Diagramme können Sie horizontal und vertikal ausgerichtet nutzen:
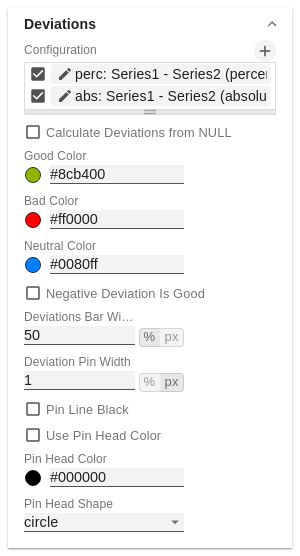
Gibt an, ob Abweichungen auch aus NULL-Werten berechnet werden sollen. Good / Bad / Neutral ColorDefinieren Sie an dieser Stelle mit welcher Farbe positiv (Good), negativ (Bad) oder neutrale (Neutral) Abweichungen dargestellt werden
Diese Option invertiert das Farbschema für die Farben der Abweichung. Beispielsweise können so negative Werte mit grüner Farbe dargestellt werden, bei Verwendung der Ausgangsfarben. Pin Line BlackDiese Option färbt die Linie der Nadel im Abweichungsdiagramm schwarz.
TitleTitle TextGeben Sie hier einen Titel für das Diagramm an. Ist die Checkbox aktiviert, wird dieser angezeigt. 
Die Kopffarbe der Nadel im prozentualen Abweichungsdiagramm. Die Farbe wird nicht auf die Nadelköpfe des Basisdiagramms angewendet.
|
Page Comparison

Manage space
Manage content
Integrations