| Excerpt |
|---|
FixationSie können die Option Beginning of X/Y Axis nutzen, um die Skalierung der Achse bei 0 oder einem anderen, beliebigen Wert beginnen zu lassen. Genau so kann für die entsprechende Achse die Option End of X/Y Axis gewählt werden, um die Skalierung der Achse bei einem beliebigen Wert enden zu lassen. | 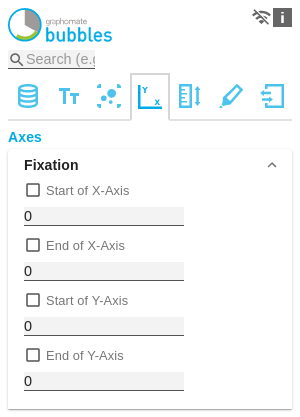 Image Removed Image Removed
|
Guides
Zur Hervorhebung von Schwell- oder Zielwerten können die sogenannten Guidelines hinzugefügt werden, deren Aussehen umfangreich anpassbar sind| Excerpt |
|---|
FixationYou can use the Start of X/Y Axis option to have the scaling of the axis start at 0 or any other arbitrary value. Similarly, you can use the End of X/Y Axis option for the corresponding axis to let the scaling of the axis end at any value. |  Image Added Image Added
| GuidesTo highlight threshold or target values, the so-called Guides can be added, whose appearance can be extensively customized. Guides Pop-Up Mit dem + Button können Liniendefinitionen hinzugefügt werden. Für jede Guideline sind folgende Optionen verfügbar: Description: Hinterlegen Sie hier die Benennung des Guides.Value: Definiert die Position der Guideline auf der Achse. Ist statt einem Zahlenwert die Zeichenkette mean eingetragen, wird als Wert der Durchschnitt, der der Achse zugrunde liegenden Datenserie, angenommen.Color: Öffnet den Color Picker, um eine Farbe für die Linie auszuwählen oder definiert die Farbe mittels HEX-CodeWith the + button Guides definitions can be added. The following options are available for each guide: - Description: Enter the name of the guide here.
- Value: Defines the position of the guideline on the axis. If the character string mean is entered instead of a numerical value, the average of the data series on which the axis is based is taken as the value.
- Color: Opens the Color Picker to select a color for the line or defines the color using HEX code.
- Width [px]: Setzt die Breite der Guideline Sets the width of the guideline in [px].
- Label: Werden an der Achse auf Position der Guideline dargestellt. Ist für das Label auto definiert, wird die Line mit einem Label versehen, das dem Achsenwert an der Position entspricht. Ist für das Label none definiert, wird kein Label dargestellt. Jeder beliebige andere eingefügte Text wird als Label dargestellt Are displayed on the axis at the position of the guideline. If auto is defined for the label, the line is provided with a label corresponding to the axis value at the position. If none is defined for the label, no label is displayed. Any other inserted text is displayed as label.
- Bold Label: Bestimmt Bestimmt, ob das Label Fett gezeichnet wird.
| 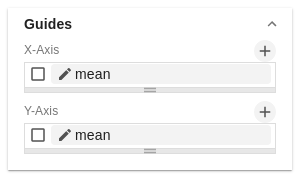 Image Modified Image Modified
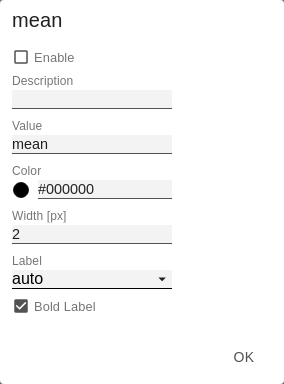 Image Modified Image Modified
| Basic Grid Lines(Ehemals Inner- und Outer Grindlines)Segments Bei Deaktivierung von Segments werden keine Gitternetzlinien des Koordiantensystems gezeichnet. BorderBei Aktivierung von Border wird immer ein Rahmen um das Koordinatensystem dargestelltSegments If segments are deactivated, no Grid Lines of the coordinator system are drawn. BorderWhen Border is activated, a frame is always displayed around the coordinate system. | 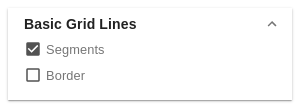 Image Modified Image Modified
| Custom Grid LinesEs gibt die Möglichkeit zusätzliche Linien im Grid darzustellen. Definiert werden diese entweder durch die Größe der Intervalle (Interval) oder die Anzahl der Schritte (Steps). Die Größe der Intervalle beschreibt den Linienabstand in der Einheit der jeweiligen Achse. Die Schrittanzahl definiert aus wie vielen Teilen die jeweilige Achse besteht. Für eine sinnvolle Darstellung sollten das Feature Segments deaktiviert werdenIt is possible to display additional lines in the grid. These are defined either by the size of the intervals (Interval) or the number of steps (Steps). The size of the intervals describes the line distance in the unit of the respective axis. The number of steps defines how many parts the respective axis consists of. For a meaningful representation the feature Segments should be deactivated. | 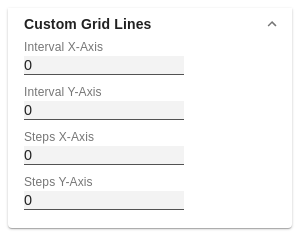 Image Modified Image Modified
|
|


