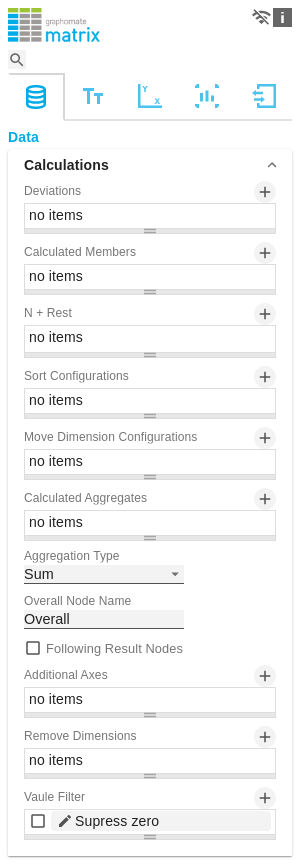
Calculation
Deviations
This property can be used to calculate deviations. It is a list, where each individual item represents the calculation of a new deviation member. The variances are calculated as follows:
Absolute: Minuend - Subtrahend
Percentage: (Minuend - Subtrahend) / |Subtrahend|
| Info |
|---|
Please note: At this point the values for deviations are only calculated. You have the possibility to visualize these calculated values on the tab "Chart Specific". |
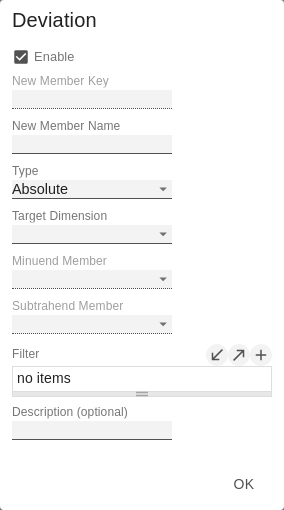
Deviations Pop-Up
You can create new variances using the  sign. Each configuration has the following properties:
- New Member Name: The unique name of the newly calculated member that is displayed in the table.
- Type: Either Absolute or Percent. Defines whether an absolute or relative deviation is calculated.
- Target Dimension: The dimension in which the new, calculated deviation member should be inserted - e.g. "measures".
- Minuend Member: The member that is to serve as a minuend, e.g. an actual value.
- Subtrahend Member: The member that is to serve as subtrahend, e.g. a value from the previous year.
- Filter (optional): A list of filter objects. Each filter object can restrict a dimension to certain members. Only deviation data points are created that correspond to the filter conditions.
- Description: Short name that describes the configuration to be recognizable e.g. "abs"
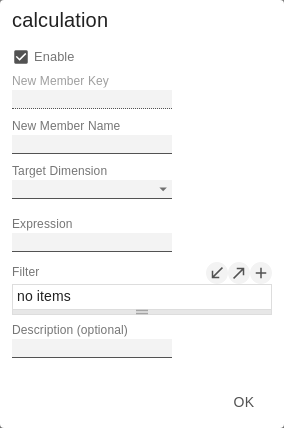
Calculated Members
Calculate additional columns, rows or members using formula input.
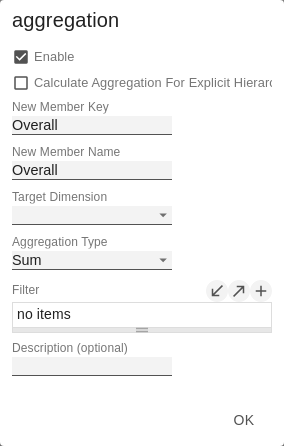
Calculated Members Pop-Up
You can create new calculated members using the sign. Each configuration has the following properties:
- New Member Name: The unique name of the newly calculated member that is displayed in the table.
- Target Dimension: The dimension in which the new, calculated member should be inserted - e.g. "measures".
- Expression: An expression to be evaluated for each calculated data point. Here, the keys of members of the dimension are encapsulated in curly brackets with leading $. (e. g. ${member1}). This results in the following possibilities, for example::
- Ratio of two members: ${member1}/${member2}
- Conversion of working hours into working days: ${workinghours} / 8
- Calculation of new measures: ${Sales}-${Costs}
You can find a detailed description of the syntax here
- Filter (optional): A list of filter objects. Each filter object can restrict a dimension to certain members. Only calculated member data points are created that correspond to the filter conditions.
- Description (optional): Short name that describes the configuration to be recognizable e.g. "abs"
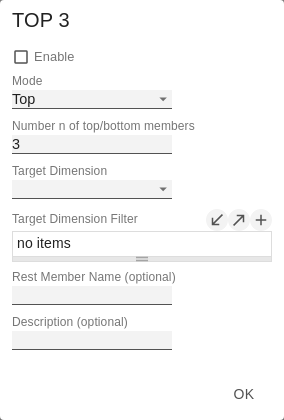
N + Rest
Define how many elements should be mapped as Top N or Bottom N with Rest representation.
N + Rest Pop-Up (Top 3)
You can create new groups for N + rest using the - sign. Each configuration has the following properties:
- Enable: Applies the N + Rest Confuration, when enabled.
- Mode: Choose between Top (top) and Bottom (bottom).
- Number n of top/bottom members: Define the number of top/bottom elements.
- Target Dimension: The dimension into which the new top/bottom member should be inserted - e.g. "measures".
- Target Dimension Filter (optional): Here you filter which members of other column dimensions should affect the ranking. If there is more than one column member and there is no filter defined, the ranking of a row is based on the sum of all columns.
- Rest Member Name (optional): Sets a label for the rest member.
- Description (optional): Short name describing the configuration to be recognizable.
Sort Configurations
Here you can sort members of dimensions. Measures are also interpreted as a dimension and can be sorted accordingly.
In future versions we will extend these options.
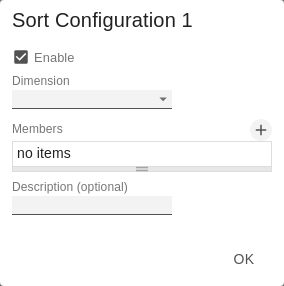
Sort Configurations Pop-up
You can use the sign to create a new sort order for a dimension. Each configuration has the following properties:
- Dimension: A dimension the members of which should be sorted.
- Member: Here you can use drag and drop to sort the members of a dimension or measures.
- Description: Short name describing the configuration to be recognizable
Move Dimension Configurations
This makes it possible to swap dimensions in the header or move them to another dimension. To do this, a configuration must be created using the Image Addedsymbol.
In the dialog, you can then select which dimension should be affected, whether it should appear in the columns or rows, and on which level of the hierarchy it should land.
Change the position of the totals to precede or follow its child nodes.
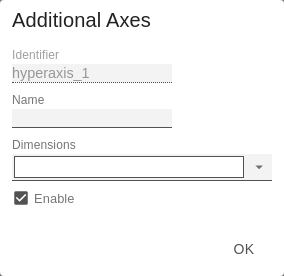
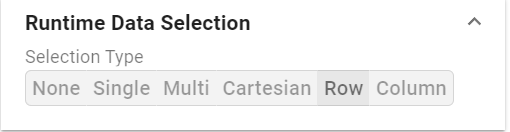
New hyper axes can be created here. These are additional axes of the data projection (in addition to the known Columns and Rows axes of a normal, two-dimensional projection). This allows multiple data values to be assigned to a cell of the matrix to display in-cell visualizations, like sparklines, from multiple values.