Category Labels
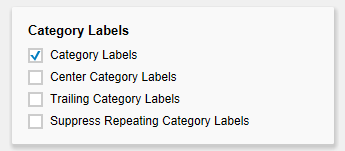
This section controls the labels of the bullet graphs. If the first checkbox is activated, the category labels are displayed for each bullet graph.
Center Category Labels
If this option is active, category labels are centered in front of/above the bullet graph bars.
Trailing Category Labels
If activated, the category labels will be shown behind/below the bars. Otherwise, the labels will be placed in front of/above the bars.
If the last checkbox is activated, repeating category labels will be suppressed.
...
...
...
...
...
...
...
...
If the option Performance Values is activated the values of the Performance Measure 1 are displayed at the end of the corresponding bar. All other values can be seen by using the Tooltips.
With the option Deviations, bars that visualize the deviation between Performance Measure 1 and Comparative Measure 1 can be toggled on and off.
Reverse Qualitative Ranges
This checkbox controls the display of the Qualitative Ranges. If this option is deselected, they are drawn from the left side (usually the value range minimum) to the input value (or calculated value). If the option is activated, the Qualitative Ranges are displayed in reverse so that the range is drawn from the input value to the value range maximum.
Micro Pies
Activating this Checkbox will display a pie chart in front of each bullet graph. This small pie displays the percentage of the primary measure as part-to-whole – the sum of the primary measure.
If a total exists in the data source, it is used as a basis for the calculation. If only partial or no sums are available, the total amount will be calculated from the data.
The diameter of the Micro Pies can be changed with the option Diameter of Micro Pies. The color of the Micro Pies can be selected with the option Micro Pie Color.
Calculate Qualitative Ranges
If this Checkbox is activated, Qualitative Ranges 1 and 3 will be calculated.
The values of Percentage for Qualitative Range 1 and 3 are used to calculate Qualitative Ranges 1 and 3 based on Qualitative Range 2.
The two missing ranges are calculated by multiplying range 2 by the values entered here. Therefore the first value should be < 1, as otherwise the bar for Qualitative Range 2 will be obscured by the bar for Qualitative Range 1.
...


