The properties of the graphomate bubbles for Discovery can be edited within the "Properties Sheet". You can access it on the side pane's Design Tab. It provides a number of property categories which you can select from by using the topmost dropdown menu.
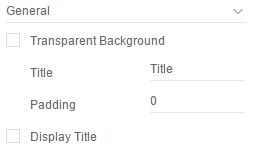
General | |
Transparent Background: Text Deactivates the background color. Title: Text You can set a title for the Bubble diagram. Padding: Text Sets the space in [px] surrounding the while diagram. Display Title: Text If the checkbox is enabled the title will be displayed on the canvas. |
|
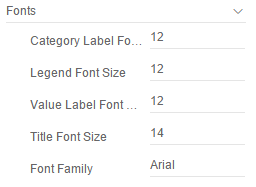
Fonts | |
Category Label Font Size: Text The Category Label font size in [px]. Legend Font Size: Text Sets the font size used by the legend in [px]. Value Label Font Size: Text The Value Label Font Size in [px]. Title Font Size: Text The font size for the title in [px]. Font Family: Text You can change the global font family. |
|
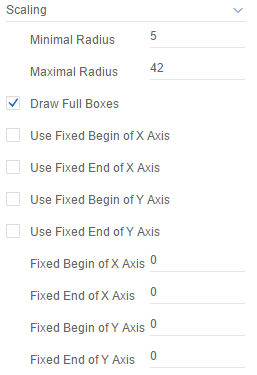
Scaling | |
Minimal Radius: Text Restricts the radius of the Bubbles in [px], so that no bubbles with a radius lower than this value can exist. Maximal Radius: Text Restricts the radius of the Bubbles in [px], so that no bubbles with a radius higher than this value can exist. Draw Full Boxes: Text Activating the checkbox will result in a scaling of the axis that ensures equally sized boxes for the whole grid. If deactivated the scaling will be chosen to optimally use the given space. This may result in half sized boxes. To prevent misleading visualizations the Outer Grid Lines will be omitted. Use Fixed Begin of X Axis: Text If activated the manual defined value for the beginning of the scale of the x axis is used. Use Fixed End of X Axis: Text If activated the manual defined value for the end of the scale of the x axis is used. Use Fixed Begin of Y Axis: Text If activated the manual defined value for the beginning of the scale of the y axis is used. Use Fixed End of Y Axis: Text If activated the manual defined value for the end of the scale of the y axis is used. Fixed Begin of X Axis: Text The value for the beginning of the scale of the x axis. Fixed End of X Axis: Text The value for the end of the scale of the x axis. Fixed Begin of Y Axis: Text The value for the beginning of the scale of the y axis. Fixed End of Y Axis: Text The value for the end of the scale of the y axis. |
|
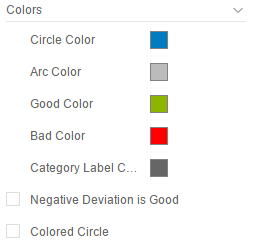
Colors | |
Circle Color: Text The color of the circle border. Arc Color: Text The color of the arc. Good Color: Text The color used for the positive deviations. Bad Color: Text The color used for the negative deviations. Category Label Color: Text The color of the category labels. Negative Deviation is Good: Text Activating the checkbox will cause positive deviations to be considered bad, therefore applying Bad Color to these deviations (and vice versa). Colored Circle: Text Activating results in the area of the circles being filled with Circle Color. |
|
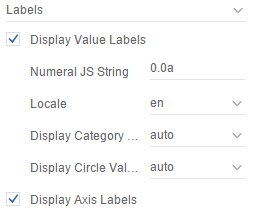
Labels | ||||||
Display Value Labels: Text With this option you can activate or deactivate the Value Labels. Please note that the Value Labels have the lowest priority in regard to the collision logic, which means they are hidden first if they overlap with other Bubbles, Value Labels, Category Labels or Circle Labels. Numeral JS String: Text Locale: Text Display Category Labels: Text Display Circle Values: Text Display Axis Labels: Text Set the format for absolute values according to the numeral.js rules – see Number Formatting. Locale: Locale can be changed here. If set to AUTO the locale of the settings is used. Display Category Labels: This option will result in the Category Labels being displayed (Always), (Never) or according to the collision logic (Auto). The Auto mode will hide Category Labels when they are colliding. Category Labels have a high priority so they will still be displayed when they collide with Value Labels or Circle Labels. They are only hidden when they collide with other Category Labels or Bubbles. Display Circle Values: This option will result in the Circle Labels being displayed (Always), (Never) or according to the collision logic (Auto). The Auto Mode will hide Circle Labels when they are colliding. Circle Labels have a higher priority than Value Labels, but a lower one than Category Labels or other Bubbles. Along these priorities the collision logic will hide or show labels. Display Axis Labels: Controls whether or not the axis labels are displayed, which result from the X Axis and Y Axis data series.
|
| |||||
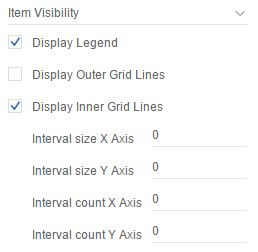
Item Visibility | |
Display Legend: Text If it is deactivated, no Legend will be displayed. When activated the legend will only show if there is a selection for the Circle, Arc or Deviation series. Display Outer Grid Lines: Text Outer Grid Lines can be activated using the checkboxes. Display Inner Grid Lines: Text Inner Grid Lines can be activated using the checkboxes. Interval size X Axis: Text Additional lines on the x axis in the grid defined by the size of the interval. Interval size Y Axis: Text Additional lines on the y axis in the grid defined by the size of the interval. Interval count X Axis: Text Additional lines on the x axis in the grid defined by the count of intervals. Interval count Y Axis: Text Additional lines on the y axis in the grid defined by the count of intervals. |
|