You have set up a Data Source and now want to visualize a data series of this query with the graphomate bubbles.
- Drag a graphomate bubbles component onto the canvas and attach a Data Source by dragging it on top of this component.
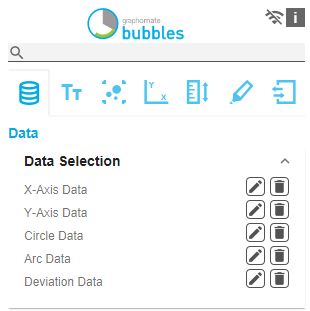
- Set the series on the Data tab in the Additional Properties Sheet graphomate property sheet by clicking on the corresponding corresponding
 Button (…) . You will be able to choose a row or column from your Data Source in the Initial View. Confirm the highlighted data by clicking
  .
. The series labels will be taken automatically from the metadata of the selected dimension members.
Align align center