To create a new graphomate chart, graphomate table or graphomate bubbles, follow these steps in WebI:
- First, click "Custom Element".
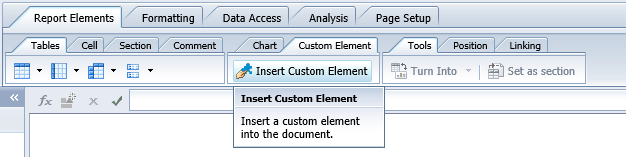
2. Then, click anywhere in the report. This is where the new element is inserted. First, however, a dialog will open, allowing you to select the element: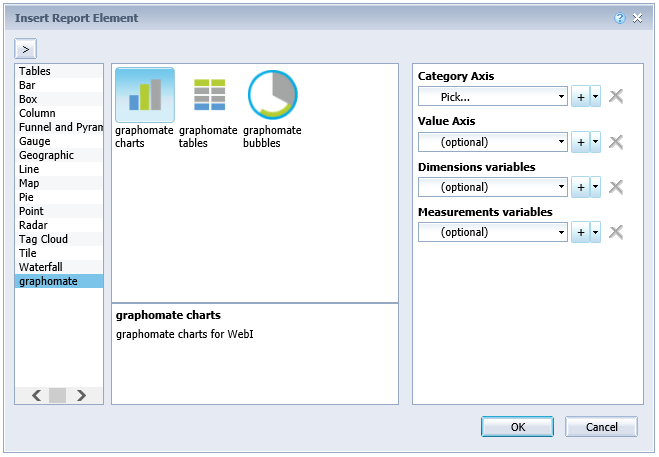
3. Select the desired Category Axis and Value Axis. By clicking "+" you can add further data series.
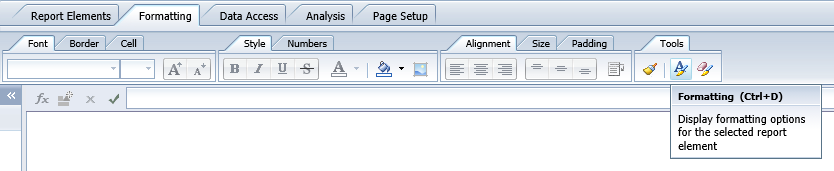
4. Format the chart, the table or the bubble using the settings dialog, which you can find under the formatting tab (in the Java client you can also right-click on the visualization to reach the dialog).