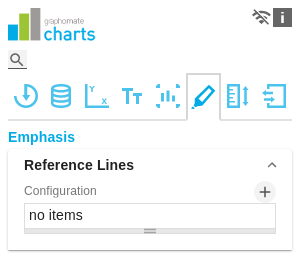
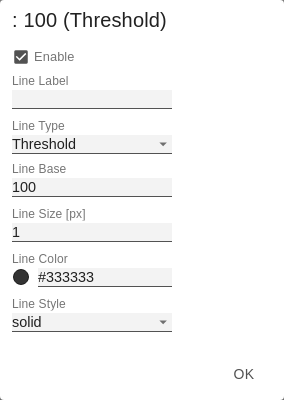
Reference LinesConfigurationWith this element you can define lines, for example to visualize certain limit values or statistical quantities. Use the + symbol to add new lines and the red trash can to delete existing line configurations. Configuration Pop-UpThe following properties can be defined:
|
|
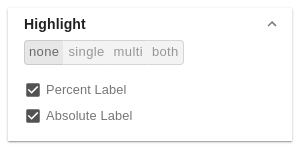
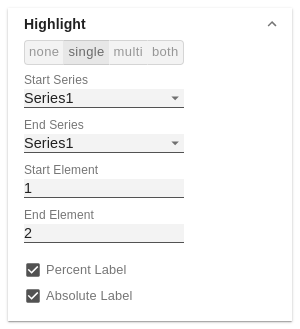
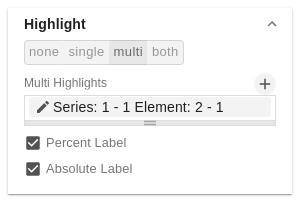
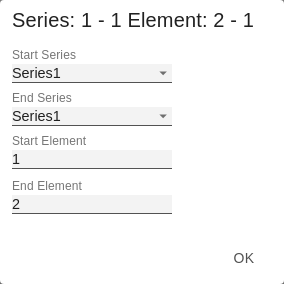
HighlightYou can use this function to highlight the absolute and/or percentage difference between different chart elements. To do this, activate the checkbox and set the indexes of the categories where the highlighting should start and end. SingleYou can choose between a single highlighting on the side (single) or highlighting multiple elements within the diagram (multi). If you choose single highlighting, the first element in the list is displayed and all other elements are ignored. You can also choose whether the absolute and/or percentage values are to be displayed. MultiIn multi mode, several highlights can be created using the + symbol. In the pop-up, you define the indexes of the categories for which the highlighting should start (Start Series and Start Element) and end (End Series and End Element). |
|
Highlight GroupEnableTo assign elements to each other, activate the Highlight Group. Match MeasuresIf this option is activated, the measures of the dimension are considered in addition to the member combination. ColorDetermines in which colour the Highlight Group should be displayed. | neuer Screenshot |
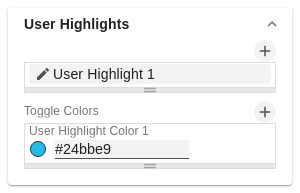
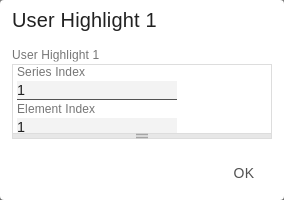
User HighlightThis property can be used to adjust and read out the list of user highlights. The User Highlights can be set at runtime by ALT + mouse click on a value in the diagram. In this way, this value is highlighted with a frame. User Highlight Pop-UpSpecify here which element should be highlighted initially. Assign the index of the series (Series Index) and the index of the element (Element Index). Toggle ColorsA list of colors through which highlights (highlighted values at run time using ALT+click) are toggled when the user repeatedly selects them. |
|
Manage space
Manage content
Integrations