Sparklines are a visualization concept by Edward Tufte, which he initially presented in 2006 in his book "Beautiful Evidence".
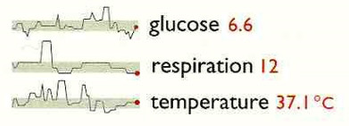
He uses the medical use case seen to the left to describe how a strongly condensed time representation can add information and thus context to an analysis which simplifies the medical classification.
Edward Tufte defines sparklines as „datawords: data-intense, design simple, word-sized graphics.“ (Source: Edward Tufte, Beautiful Evidence, p.47)
The idea quickly spread to business reporting applications where data over time needs to be displayed. Especially in combination with bullet graphs, sparklines are a valuable addition to dashboard applications.
As we have implemented the full bullet graph concept by Stephen Few in our graphomate bullet graphs, supplemented by a few additions to integrate the International Business Communication Standards (IBCS), it immediately suggested itself to offer a sparkline component for SAP Designer as well.
The graphomate sparklines component offers features to further enhance the perception:
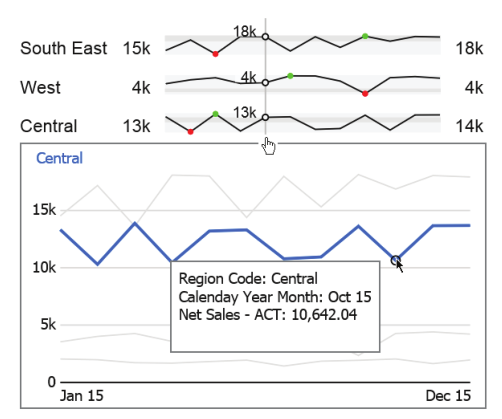
- first and last value as well as maximum and minimum of each data series can be highlighted,
- specific values are displayed along a vertical line, the so-called "ruler",
- gray areas in the background - Overall Range - indicate the location of a sparkline with the overall context,
- a click on a sparkline will open a popup that shows all sparklines as line charts. In the popup, they are scaled identically and are thus inherently comparable.
In the sense of a uniform language regulation we speak in the further manual of Lumira Designer or briefly Designer. Our products are still compatible with SAP Design Studio 1.6.
For our graphomate sparklines extension Lumira Designer >= 2.0 SP03 and IE 11+ are required. For further information, for example about the deployment on the Business Intelligence Platform (BIP) or SAP Netweaver, please consult the Product Availability Matrix (PAM).
Please note that we will no longer support Internet Explorer 9 and 10 from 2017.


