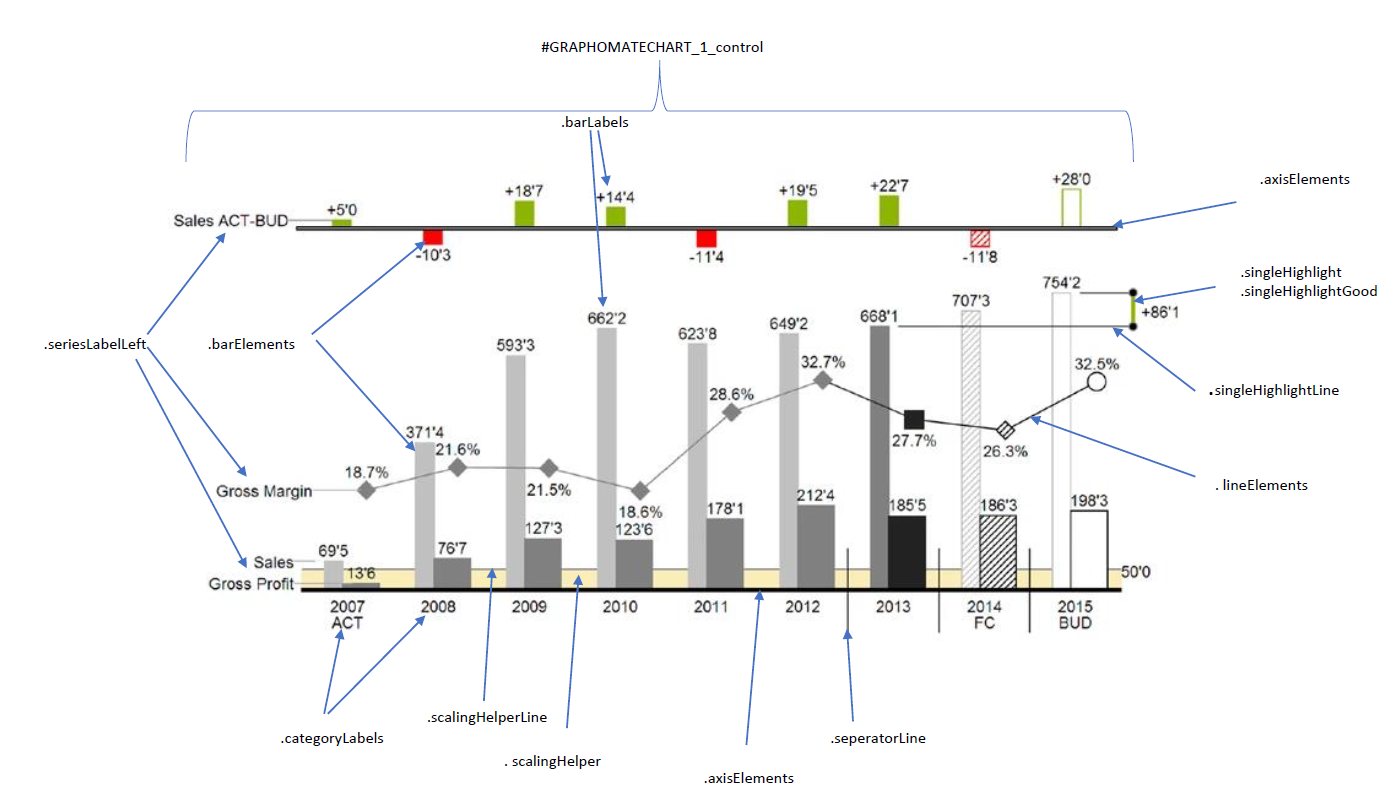
Overview of css classes
The following illustrations provides some of the css selectors, which can be adressed by using the Custom CSS in Designer.

The chart elements contain the hierarchy level as a CSS class, when provided by the query. Furthermore we recommend using a browser console to inspect the elements for their CSS classes.
A few examples:
.lineElements {
	stroke: red !important;
}

#GRAPHOMATECHART_1_control .lineElements.seriesIndex1 {
	stroke: red !important;
}

.scalingHelper {
    fill: aliceblue;
}

.barElements {
	stroke: red;
}
|
From version 2.6.2 the datatype attribute selector for CSS formatting of SVG elements will be deprecated. In the future, please use the new datatype CSS class for selecting elements according to their datatype. The datatype attribute will be removed in a future version of the charts. |