do an action on a datasource at runtime that changes its initial view you have to change the data selection of every connected extension component as well. This Article describes how to change the data selection of a extension component via BIAL script.
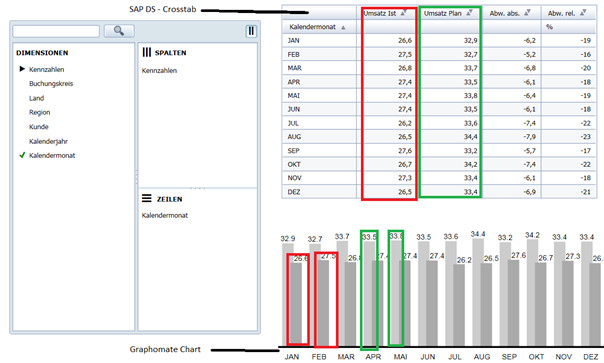
In the screenshot below there is a SAP DS (Design Studio) - crosstab as well as a graphomate chart. Both elements refer to the same DataSource. While the SAP DS – crosstab shows all key figures which are defined in the initial view of the DataSource, the graphomate chart only shows the key figures which are explicitly defined in the data series. When key figure “Umsatz Ist” is filtered out by the navigation panel on the left side, the DS – crosstab will be reduced by this key figure. The following steps show how to prepare the graphomate extension to filter it out as well.
Step-by-Step-Guide
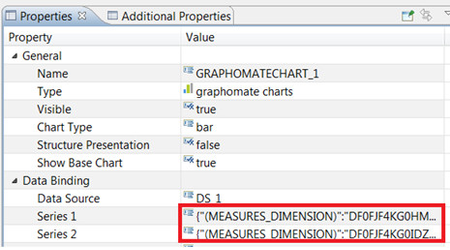
- Check the technical names of the defined series of the graphomate chart in the properties sheet and copy them in an empty text file (i.e. DF0FJF4KG0HMAY4DVXJLPAZXM, DF0FJF4KG0IDZKG57GZ7RQE7E).
Insert the following code in the On Result Set Changed method of the DataSource.
//check if keyfigure1 and keyfigure 2
//Define Array xx for all members of 0CALMONTH2
var xx = DS_1.getMembers("0CALMONTH2", 12);

//define a boolean variable for the first key figure
var firstkeyfigure = false;

//check the first keyfigure (DF0FJF4KG0HMAY4DVXJLPAZXM) for each member of 0CALMONTH2.
//if a valid value is found for any member the boolean variable "firstkeyfigure" is set to "true"
//Depending of the structure of your DataSource you have to replace DF0FJF4KG0HMAY4DVXJLPAZXM,
//DF0FJF4KG0IDZKG57GZ7RQE7E and 0CALMONTH2 with the correct names of your keyfigures dimensions

xx.forEach(function(element, index) {
  DS_1.getDataAsString("DF0FJF4KG0HMAY4DVXJLPAZXM", {
  	"0CALMONTH2": element
  });
 if (DS_1.getDataAsString("DF0FJF4KG0HMAY4DVXJLPAZXM", {
  	"0CALMONTH2": element}).length != 0){
  		firstkeyfigure = true;
  	}

});


//do the same check for all other relevant keyfigures
var secondkeyfigure = false;

xx.forEach(function(element, index) {
  DS_1.getDataAsString("DF0FJF4KG0IDZKG57GZ7RQE7E", {
  	"0CALMONTH2": element
  });
 if (DS_1.getDataAsString("DF0FJF4KG0IDZKG57GZ7RQE7E", {
  	"0CALMONTH2": element}).length != 0){
  		secondkeyfigure = true;
  	}

});


//Check: if both keyfigures are set (variables = true) the chart series will be set to both key figures
//otherwise there will be a check if the first key figure is set. In this case the
//chart series will only set the first key figure...

if (firstkeyfigure == true && secondkeyfigure == true){
	GRAPHOMATECHART_1.setSeries(1,'{"(MEASURES_DIMENSION)":"DF0FJF4KG0HMAY4DVXJLPAZXM"}');
	GRAPHOMATECHART_1.setSeries(2,'{"(MEASURES_DIMENSION)":"DF0FJF4KG0IDZKG57GZ7RQE7E"}');
}
else if (firstkeyfigure == true) {
	GRAPHOMATECHART_1.setSeries(1,'{"(MEASURES_DIMENSION)":"DF0FJF4KG0HMAY4DVXJLPAZXM"}');
	GRAPHOMATECHART_1.setSeries(2,"");
}
else if (secondkeyfigure == true){
	GRAPHOMATECHART_1.setSeries(1,"");
	GRAPHOMATECHART_1.setSeries(2,'{"(MEASURES_DIMENSION)":"DF0FJF4KG0IDZKG57GZ7RQE7E"}');
}
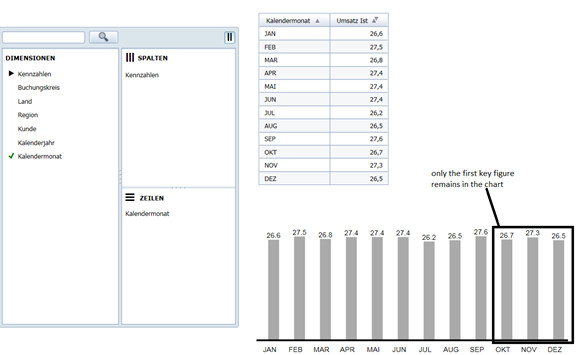
After filtering out the second key figure now only the first key figure remains in the chart.
Related Articles