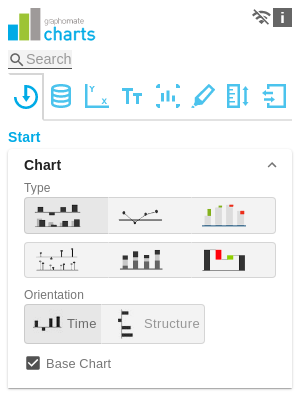
ChartTypeYou can select the desired diagram type by clicking on the corresponding icon. OrientationAll diagrams can be used horizontally and vertically aligned:
Base ChartThe Base Chart checkbox shows and hides the basic chart. This allows deviation charts to be used without basic charts. Chart Type By SeriesTo display combination charts, select the desired chart type from the dropdown (None, Bar, Line, Offsetbar, Pin, Stackedbar, Waterfall). |
|
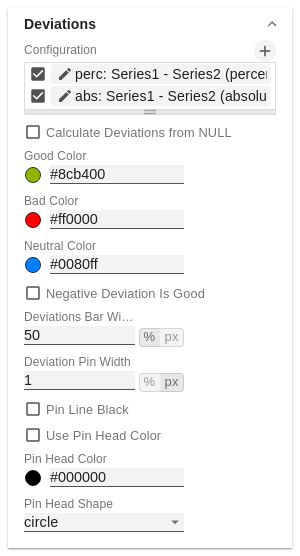
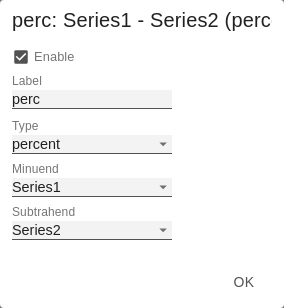
DeviationsConfigurationUse the + sign to create deviations, which are shown above the basic diagram. To remove a deviation, click the red trash can. By default, an absolute and a percentage deviation are shown. The checkbox (de)activates the visibility of a deviation. Configuration Pop-UpThe checkbox Enabled sets the visibility of the selected deviation.
Calculation: Absolute: minuend- subtrahend Percentage: (minuend - subtrahend) / | subtrahend| The order in which these deviation axes are displayed corresponds to the order in the Deviations Configuration. Calculate Deviations from NULLSpecifies whether deviations should also be calculated from NULL values. Good / Bad / Neutral ColorAt this point, define the color with which positive (Good), negative (Bad) or neutral (Neutral) evaluated deviations are displayed. Negative Deviation Is GoodThis option inverts the color scheme for the colors of the deviation. For example, negative values can be displayed with green color when using the original colors. Deviation Bar Width for ScenariosThe Bar Width applies to the bar width (percent or absolute) of the absolute deviations. (Applies if the option 'Scenarios in Deviation' on the Data Tab is activated). Pin Line BlackThis option colors the needle line in the deviation graph black. Use Pin Head Color(De)activates the selected Pin Head Color. If deactivated, the stored color values of the deviations are applied (default: green/red) Pin Head ColorThe head color of the needle in the percentage deviation diagram. The color is not applied to the needle heads in the base chart. Pin Head ShapeSelect which shape in the line chart is used for a data point. The following options are available:
|
|
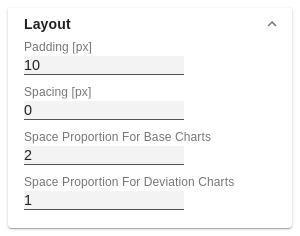
LayoutPaddingPadding in [px] sets a border around the diagram. SpacingSpacing also in [px] defines the distance between the basic and deviation diagram. Space Proportion For Base ChartPlace that the Base Chart takes up. Formula for determining the space: Factor / (sum of all factors) Space Proportion For Deviation ChartsSpace that a deviation diagram takes up. Formula for determining the space: |
|
Manage space
Manage content
Integrations