To display so-called "small multiples" use the following options.: Determine which dimension should be used as the split dimension for the calculation of the small multiples. Defines the number of charts to be displayed before the 'Rest' position. Defines the minimum width of each small multiple chart. Defines the minimum height of each small multiple chart. Use this option to restrict the number of members (N + Rest) of a dimension. You can define one configuration of N + rest for the graphomate charts: At this point you define the styling of a series. Use the Series Style pop-up to define the appearance of the data series, provided you do not use scenarios. Scenarios overwrite the Series Styles. Copy this string to use Series Styles in other graphomate charts components. Use the checkbox to specify which of the series should be visible in the chart. The Element Offset parameter determines the displacement of the elements on the category axis relative to each other. This can be specified in percent or absolute in [px] using the switch. Negative values can also be used for displacement in the opposite direction. Der Offset kann hier pro Serie festgelegt werden. Width can only be applied to column and bar charts. The list element contains all definitions of scenarios in this diagram. By clicking on the + symbol a new scenario is created. When hovering over a list element, a red trash can appears, which implies that a scenario has been deleted. Copy this string to use scenarios in other graphomate charts components. The scenarios can be assigned in two ways: The scenarios are applied in the following order of precedence: If the checkbox is activated, the scenarios of the first data series are displayed in the axes if Axis Thickness is greater than or equal to 3 [px]. If the checkbox is activated, a legend with the respective scenarios is displayed in the diagram. These can be changed later directly in the diagram by the user via a dropdown menu. The scenario legend is only functional in connection with the property "Scenarios by Series". If the checkbox is activated, the scenarios are shown in the deviations. This property determines which data is assigned to which scenario. Each configuration has the following properties: This value determines to what extent chart elements should be hidden that are not selected. The value starts at 0.0 (completely hidden) and goes up to 1.0 (completely visible).Small Multiples
Split Dimension
N Count
Min Width [px]
Min Height [px]

N + Rest
N + Rest Pop Up


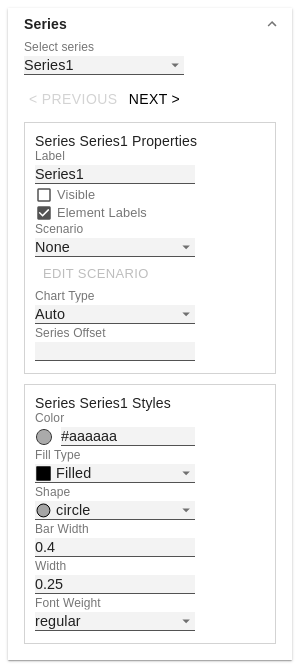
Series
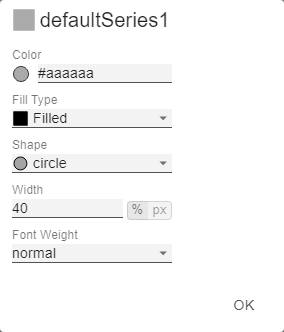
Styles
Import/Export
Visibilities
Element Offset
Offset per Series
Series Style Pop-Up
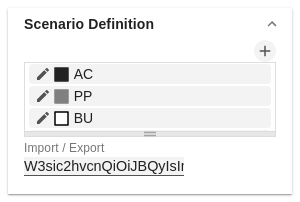
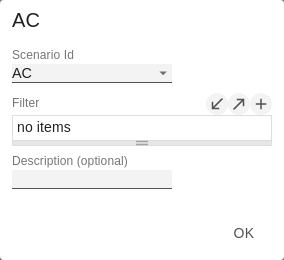
Scenario Definition
Import/Export
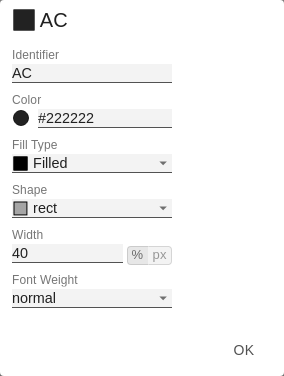
Scenario Definition Pop-Up
Scenario Assignment
Scenarios In Axis
Scenario Legend
Scenarios In Deviations
Scenarios by Dataselection
![]() sign.
sign.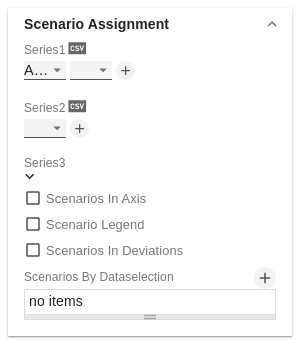
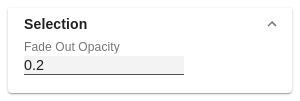
Selection
Fade Out Opacity
Manage space
Manage content
Integrations