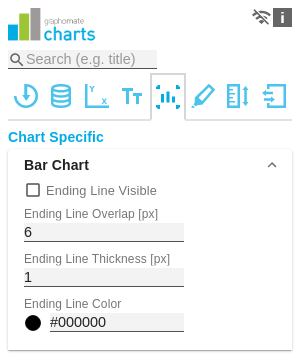
Bar ChartEnding Line VisibleThe checkbox (de)activates the ending lines in the bar or column chart. Ending Line Overlap [px]The value overlap of the KPI ending lines in [px] right and left above the bar. Ending Line ThicknessDefine the thickness of the ending lines in [px]. Ending Line ColorSpecify the color value of the KPI ending lines. |
|
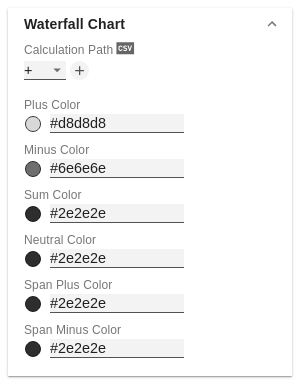
Waterfall ChartDetermine the colors of the waterfall elements - corresponding to the calculation path. Calculation PathFor the flexible use of the waterfall you store the corresponding arithmetic operation here. By clicking on the csv symbol you can switch between the standard field input or the comma separated input. possible calculation options:
Waterfall ColorsSet color values for the different calculation options using the Color Picker or a HEX code. Please note that the use of scenarios overrides this formatting. |
|
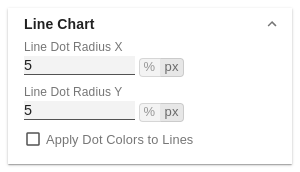
Line ChartLine Dot Radius XSpecify the X-radius in the line chart. The input value can be interpreted as a percentage or absolute value. Line Dot Radius YSpecify the Y-radius in the line chart. The input value can be interpreted as a percentage or absolute value. By differentiating between X and Y, ellipses and the like can also be implemented. |
|
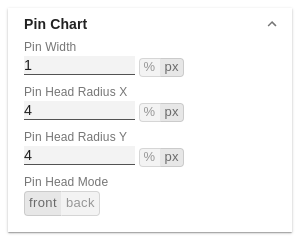
Pin ChartPin WidthDefine the thickness of the line of pins in pin charts. With Pin Width = "0" you can implement a dot chart. The input value can be interpreted as a percentage or absolute value. Pin Head Radius XSpecify the X-radius in the needle chart. The input value can be interpreted as a percentage or absolute value. Pin Head Radius YSpecify the Y-radius in the needle chart. The input value can be interpreted as a percentage or absolute value. Pin Head ModeThe setting front (top aligned) draws the needle head in front of the line and concludes above with the value of the respective element value. The setting back (center aligned) draws the needle head behind the line and positions the head centered on the respective element value. |
|
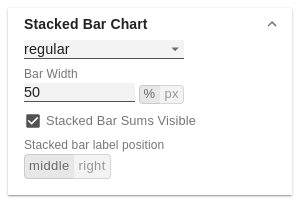
Stacked Bar ChartControls the mode of the stacked bar charts. The following modes are available:
Stacked Bar Sums Visible(De)activates the totals above the stacks. The input value can be interpreted as a percentage or absolute value. Stacked Bar Label PositionControls whether the labels of the stack are displayed in the middle or on the right. |
|
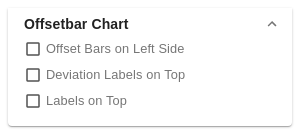
Offsetbar ChartOffset bars on left sideDisplays the deviation bars of the offset bar chart on the left instead of the right. Deviation Labels On TopAlways shows the labels of the deviations at the top of the offset bar charts. Otherwise, the negative deviation labels are displayed within the bar. Labels on Top Shows the labels of the offset bar above the bar and not within it. |
|
Manage space
Manage content
Integrations