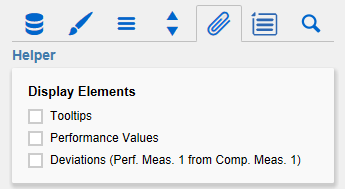
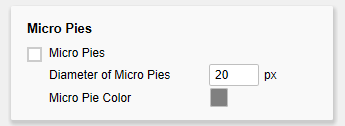
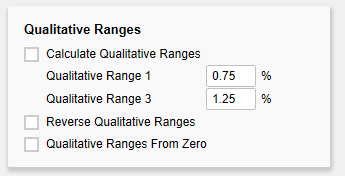
Display ElementsEnable TooltipsIf this checkbox is activated, tooltips with detailed information will be displayed while hovering over the bullet graph elements during runtime. Performance ValuesIf this options is activated, the values of the Performance Measure 1 are displayed at the end of the corresponding bar. All other values can be seen by using the Tooltips. DeviationsWith this option, bars that visualize the deviation between Performance Measure 1 and Comparative Measure 1 can be toggled on and off. Micro PiesActivating this Checkbox will display a pie chart in front of each bullet graph. This small pie displays the percentage of the primary measure as part-to-whole – the sum of the primary measure. If a total exists in the data source, it is used as a basis for the calculation. If only partial or no sums are available, the total amount will be calculated from the data. The diameter of the Micro Pies can be changed with the option Diameter of Micro Pies. The color of the Micro Pies can be selected with the option Micro Pie Color. Qualitative RangesCalculate Qualitative RangesIf this Checkbox is activated, Qualitative Ranges 1 and 3 will be calculated. The values of Percentage for Qualitative Range 1 and 3 are used to calculate Qualitative Ranges 1 and 3 based on Qualitative Range 2. The two missing ranges are calculated by multiplying range 2 by the values entered here. Therefore the first value should be < 1, as otherwise the bar for Qualitative Range 2 will be obscured by the bar for Qualitative Range 1. Yet the second value should be > 1, as otherwise the bar for Qualitative Range 3 will be obscured by the bar for Qualitative Range 2. Reverse Qualitative RangesThis checkbox controls the display of the Qualitative Ranges. If this option is deselected, they are drawn from the left side (usually the value range minimum) to the input value (or calculated value). If the option is activated, the Qualitative Ranges are displayed in reverse so that the range is drawn from the input value to the value range maximum. Qualitative Ranges from ZeroIst diese Option aktiv, werden die Qualitative Ranges nicht mehr vom linken Rand des Zeichenbereichs, sondern von der 0-Achse aus gezeichnet. |
General
Content
Integrations


