Versions Compared
compared with
Key
- This line was added.
- This line was removed.
- Formatting was changed.
Charts that have been created using graphomate charts for Excel can be embedded in other MS Office applications, e.g. PowerPoint as OLE objects.
- Copy the respective chart with StrgCTRL+c C (or StrgCTRL+V) to the clipboard.
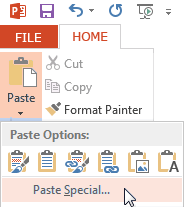
- Switch to the target application, e.g. PowerPoint and select on Home > Paste > Paste special the following: Paste link (on the left side) as Microsoft Excel Chart Object


Now, the graphomate the graphomate chart for Excel is Excel is embedded into the PowerPoint slide as OLE object, and can be refreshed if the data in Excel changes.
Please note: The original charts has to be opened already in Excel. If PowerPoint respectively Word are opened first, the automated startup of the Excel workbook will result in a row of error messages, as in this case, a connection to the graphomate add-in cannot be established.