graphomate charts as an embedded OLE object
- Tim Schauder
- Stefanie Schröder (Unlicensed)
- Konradin Schoemers (Unlicensed)
Owned by Tim Schauder
Last updated: May 23, 2017 by Stefanie Schröder (Unlicensed)
Charts that have been created using graphomate charts for Excel can be embedded in other MS Office applications, e.g. PowerPoint as OLE objects.
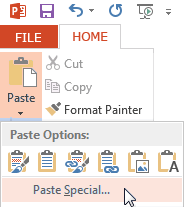
- Copy the respective chart with CTRL+C (or CTRL+V) to the clipboard.
- Switch to the target application, e.g. PowerPoint and select on Home > Paste > Paste special the following: Paste link (on the left side) as Microsoft Excel Chart Object
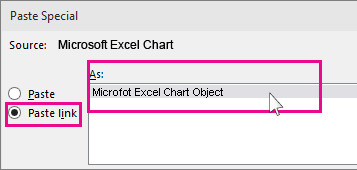
Now, the graphomate chart for Excel is embedded into the PowerPoint slide as OLE object, and can be refreshed if the data in Excel changes.
Please note: The original charts has to be opened already in Excel. If PowerPoint respectively Word are opened first, the automated startup of the Excel workbook will result in a row of error messages, as in this case, a connection to the graphomate add-in cannot be established.
, multiple selections available, Use left or right arrow keys to navigate selected items