Appendix
- Tim Schauder
- Stefanie Schröder (Unlicensed)
- Konradin Schoemers (Unlicensed)
Waterfall Calculation Path
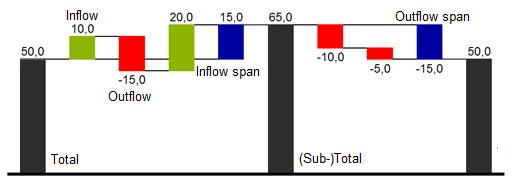
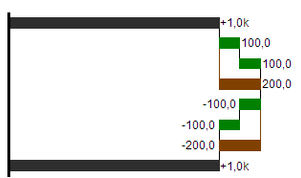
A waterfall chart – often also called a flying bricks chart – shows how an initial value is increased (inflow) or decreased (outflow) by a series of values, which lead to a final value – if necessary with subtotals and spans.
For a flexible use of the waterfall in graphomate charts an additional Data Series has to be defined: the Waterfall Calculation Path. This Data Series determines, whether the value to be shown is an in- or an outflow value, a (sub-)total or a span. In general, the sign of the data series value determines the effect on the (sub-) totals of the waterfall. Negative values are interpreted as outflow values, positive values are interpreted as inflow values and colored according to the color scheme on the Appearance tab.
In case of using Data Types the colors of the Data Types overwrite the color scheme of the Appearance tab.
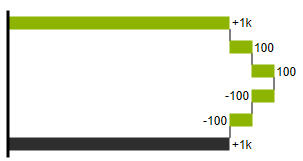
By default, the last element of a waterfall is interpreted as the sum total. A waterfall without entries in the Waterfall Calculation Path would therefore look like this. By defining the Waterfall Calculation Path the appearance and the sign of each waterfall element can be controlled independently - even via scripting language. The following options can be used:
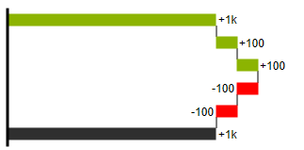
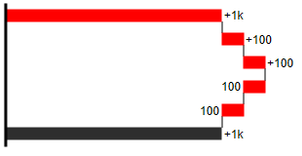
+=inflow
Positive signs are suppressed, the ![]() -color is applied to the elements.
-color is applied to the elements.
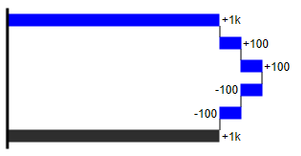
-=outflow
Negative signs are suppressed, the ![]() -color is applied to the elements.
-color is applied to the elements.
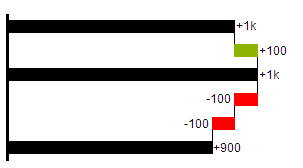
0 =neutral position
All signs are shown, the (0)-color is applied to the elements.
==(Sub-)total
The element starts at the value axis and the (=)-color is applied to those elements.
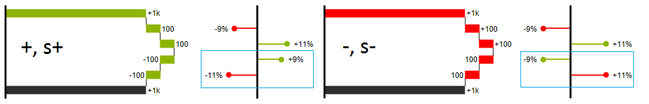
s-=outflow span
With the help of a span single changes can be summarized starting from a (sub-)total.
With an outflow span single cost items can be aggregated to a total cost.
Corresponding to outflow elements (see above) negative signs are suppressed and the (s-)-color is applied to the elements.
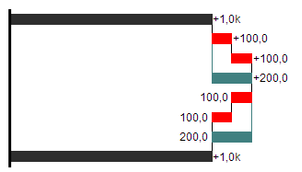
s+=inflow span
With an inflow span single inflow items can be aggregated starting from a (sub-)total.
Corresponding to inflow elements (see above) positive signs are suppressed and the (s+)-color is applied to the elements.
The (-) and (s-)values in the Waterfall Calculation Path also have an effect on the corresponding deviation charts: For negative values, which are now shown without signs based on the (-) and (s)-entries, the sign and the orientation of the deviation is reversed by necessity. Otherwise there is a risk of misinterpretation.