You have defined a Data Source and now want to depict data series from this query with a graphomate bullet graph.
- In Visualize room choose graphomate bullet graphs at the Chart Extensions.
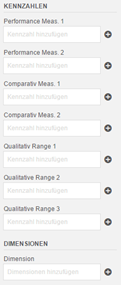
- Now 8 so called Feeds appear. You can fill them with Dimensions or Mesures.
- To fill the Feeds, click on the + symbol or drag and drop a measure or a dimensions directly to the appropriate feed.
| Center |
|---|
|