/
Quick Start
Quick Start
- Konradin Schoemers (Unlicensed)
- Stefanie Schröder (Unlicensed)
- Daniel Molkentin
- Tim Schauder
Owned by Konradin Schoemers (Unlicensed)
Last updated: May 16, 2017 by Stefanie Schröder (Unlicensed)
You have defined a Data Source and now want to depict data series from this query with a graphomate bullet graph.
- In Visualize room choose graphomate bullet graphs at the Chart Extensions.
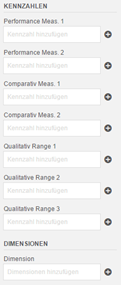
- Now 8 so called Feeds appear. You can fill them with Dimensions or Mesures.
- To fill the Feeds, click on the + symbol or drag and drop a measure or a dimensions directly to the appropriate feed.
, multiple selections available,
Related content
Quick Start
Quick Start
More like this
Quick Start
More like this
Quick Start
Quick Start
More like this
Quick Start
More like this
en Quickstart (TBL)
en Quickstart (TBL)
More like this
en Quickstart (SAC)
en Quickstart (SAC)
More like this