Quick Start
- Jens Beckmann (Unlicensed)
- Stefanie Schröder (Unlicensed)
You have defined a Data Source on basis of a SAP BW Query and now want to depict data series from this query with a graphomate bullet graph.
- Drag the component graphomate bullet graphs to the canvas and bind the Data Source to this component via Drag&Drop.
On the Data tab you are able to assign the data series from the query in the Initial view – in rows or columns – by clicking the corresponding series button. Just click on a row or column header or select a range with the "Ctrl" key pressed. The selected data series is highlighted in blue. Now activate the selection via click.
The data series will now be shown in the bullet graph. "x" deletes the assignment of the data series.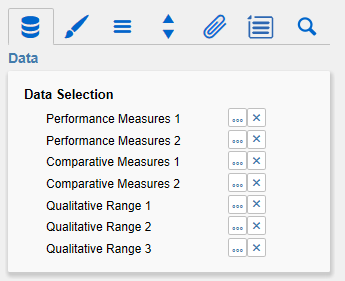
Further options can be used to alter the appearance of the bullet graphs in the Additional Properties Sheet. Checkboxes in front of the give you the possibility to control the visibility of elements in the bullet graph.