Introduction
- Jens Beckmann (Unlicensed)
- Stefanie Schröder (Unlicensed)
- graphomate Team
A bullet graph is a variation of a bar graph developed by Stephen Few middle of the last decade. Seemingly inspired by the traditional thermometer charts and progress bars found in many dashboards, the bullet graph serves as a replacement for dashboard gauges and meters. Bullet graphs were developed to overcome the fundamental issues of gauges and meters: they typically display too little information, require too much space, and are cluttered with useless and distracting decoration.
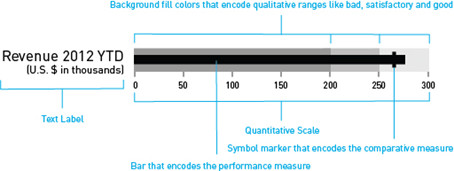
The bullet graph features a single Performance Measure (e.g. current year-to-date revenue), compares that measure to one or more other measures to enrich its meaning (for example, compared to a target), and displays it in the context of Qualitative Ranges of performance, such as poor, satisfactory, and good. The Qualitative Ranges are displayed as varying intensities of a single hue. A quantitative scale and a text label complete the bullet graph.
graphomate bullet graphs can be used horizontally and vertically aligned as well as scaled identically. According to the number of dimension members in the query multiple bullet graphs are drawn. A Reverse Quantitative Scale - for example, for costs representations - can be easily realized.
If the Qualitative Ranges are missing in the database, these values can be determined on percentage values based on any measure in the query.
graphomate bullet graphs support the International Business Communication Standards (IBCS):
- Availability of data types for a dashboard-wide uniform notation
- Visualization of the deviation of Performance Measures from Comparative Measures
- Normalization to target values possible
- Cross-scaling of graphomate components via Comparison Group
In the sense of a uniform language regulation we speak in the further manual of Lumira Designer or briefly Designer.
For our graphomate bullet graphs extension Lumira Designer >= 2.0 SP03 and IE 11+ are required. For further information, for example about the deployment on the Business Intelligence Platform (BIP) or SAP Netweaver, please consult the Product Availability Matrix (PAM).
Please note that we will no longer support Internet Explorer 9 and 10 from 2017.