Properties
- Konradin Schoemers (Unlicensed)
- Stefanie Schröder (Unlicensed)
- Daniel Molkentin
- Tim Schauder
Basically the features of the graphomate bullet graphs can only be maintained in the Storyboard room. If you have created a visualisation in the Visualize room, you can drag and drop this visualisation to the visualisation area in the Compose room. If you have done so, the Visualisation Properties appear at the right side of the page when you click on the visualisation.
Appearance Tab |
|
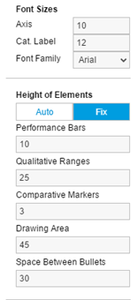
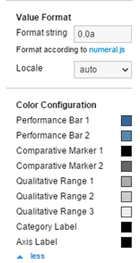
Font SizesSet here the font size of the axis labelling (Axis) and the Category Label (Cat. Label). In addition a Font Family can be chosen (out of four available fonts currently). Height of ElementsDepending on the orientation of the Bullet Graphs these values describe the height (vertical) or the width (horizontal) of the corresponding elements. Value FormatSelect the format of the Category Labels according to guidelines of numeral.js – see Appendix. Locale sets the label country format in the Basic mode. DE, FR, EN and AUTO are available options. Choosing auto the Locale is retrieved from the preferences. Color ConfigurationAt this point the differnt colors of the bullet graph can be set; first of all the colors for Performance Bars (1 and 2), in the next section the colors for the Comparative Marker (1 and 2) and finally the colors for the 3 Qualitative Ranges. |
|

Behaviour Tab |
|
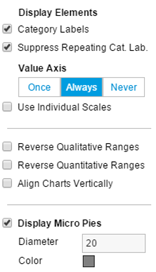
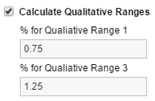
Display ElementsThis section controls the labels of the bullet graphs. If the first Checkbox is activated, the Category Labels are displayed. If the second Checkbox is activated, repeating Category Labels will be suppressed. Value AxisThis option controls the display of the Value Axis. Always draws one Value Axis for each bullet; Once draws a single Value Axis, which applies to all bullet graphs. This appears at the bottom of the component. Never suppresses the display of the Value Axis completely. Use Individual ScalesIf this Checkbox is activated, each bullet axis is calculated individually. Otherwise all bullets are scaled identically. While choosing Value Axis option Once, Use Individual Scales is disabled. Reverse Qualitative RangesThis Checkbox controls the display of the Qualitative Ranges. If this option is deselected, they are drawn from the left side (usually the value range minimum) to the input value (or calculated value). If the option is activated, the Qualitative Ranges are displayed in reverse so that the range is drawn from the input value to the value range maximum. Reverse Quantitative RangesThis Checkbox controls the representation of the axis. If this option is activated, the axis is drawnfrom n to 0, otherwise the scaling is inverted – from 0 to n. Align Charts VertivallyThis Checkbox describes the orientation of the bullets. If it is activated, they are displayed vertically, otherwise they are displayed horizontally. Display Micro PiesActivating this Checkbox will display a pie chart in front of each bullet graph. This small pie displays the percentage of the primary measure as part-to-whole – the sum of the primary measure.If a total exists in the data source, it is used as a basis for the calculation. If only partial or no sums are available, the total amount will be calculated from the data.The diameter of the Micro Pies can be changed with the option Diameter of Micro Pies. The color of the Micro Pies can be selected with the option Micro Pie Color. Calculate Qualitative RangesIf this Checkbox is activated, Qualitative Ranges 1 and 3 will be calculated. |
|

Info Tab |
|
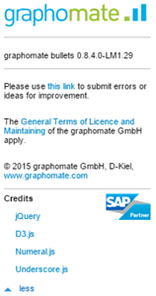
Here you can find the version number of our graphomate bullet graphs as well as a link where you may report bugs or propose wishes for new features. A list of all open-source libraries that we used can be found under Credits. |
|