Appearance Tab
- Jens Beckmann (Unlicensed)
- Stefanie Schröder (Unlicensed)
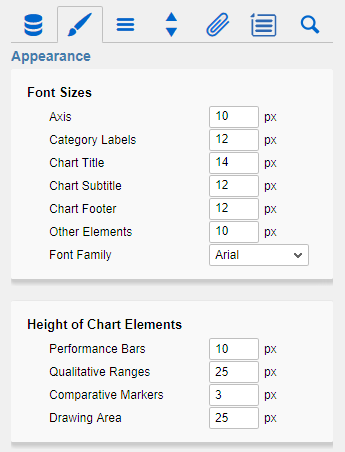
Font SizesSet here the font size of the axis labelling (Axis), the Category Label, the Chart Title, Chart Subtitle and Chart Footer. In addition a Font Family can be chosen (out of four available fonts currently). Height of Chart ElementsThe first value determines the height/width of the Performance Bars. The second value determines the height/width of the Qualitative Bars. The height /width of the bullet graphs component is coupled with this option. The third value determines the width of the Comparative Markers. A minimum value of 3 should be selected here when using Data Types with hatching, otherwise the fill pattern cannot be displayed correctly. The fourth value determines the height/width of the drawing area for a single bullet graph. In order to realize a distance between the axis label and the bullet grap, the height of the drawing area has to be larger than the height of the qualitative ranges. Furthermore, the height of the drawing area serves as a basis for calculation when data types with a percentage width are assigned. |
|
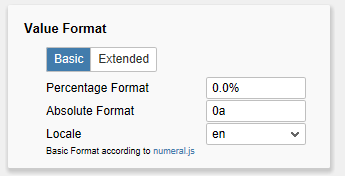
Value FormatSelect the format of the Category Labels:
Select the format of the absolute and percentage values according to guidelines of numeral.js – see Appendix page 19. Locale sets the label country format in the Basic mode. DE, FR, EN and AUTO are available options. Choosing AUTO the Locale is retrieved from the Data Source. |
|
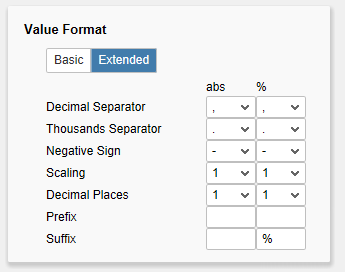
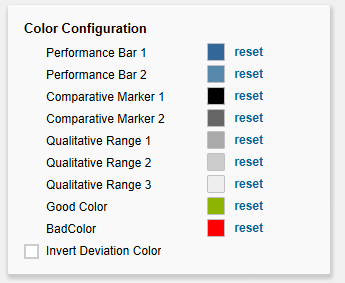
If a fixed format is preferred, put the format for absolute and percentage values here. Choosing a “(“ in the box Negative Sign will show negative values in brackets: (1234). The parameter in the box Scaling is used as a divisor for scaling the data label. The resulting format string can also be set via scripting language (for further details see Input options for the Extended value format string). Color ConfigurationIn this paragraph, the different colors of the bullet graph can be set; first of all the colors for Performance Bars (1 and 2), in the next section the colors for the Comparative Markers (1 and 2) and finally the colors for the 3 Qualitative Ranges. Good Color and Bad Color are used for the connectible deviations; the option Invert Deviation Color can be used to invert both colors (e. g. if a positive deviations needs to be displayed in red). |
|