Data Tab
- Jens Beckmann (Unlicensed)
- Stefanie Schröder (Unlicensed)
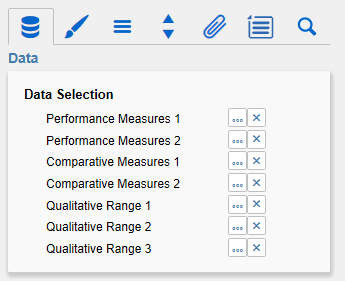
Data SelectionHere you can link the seven data series from the data source that you want to display by clicking the corresponding series button and choosing a column or row title in the following window – the initial view. The selected data series is highlighted in blue. Click "Ok" to confirm the selection. "x" deletes the assignment of the data series. Performance Measures 1 and 2The Performance Measures are shown as small colored bars in the middle of the bullet graph. With increasing ordinal number, the bars get longer; the value for Performance Measure 2 should therefore be greater than that of Performance Measure 1, otherwise the bar will be obscured by Performance Measure 1. Comparative Measures 1 and 2The Comparative Measures are shown as vertical dashes to the axis – or in the shape of the assigned data type. Qualitative Ranges 1 to 3There are three Qualitative Ranges available. These can be either assigned from a Data Source or calculated from a single Data Series (therefore the Checkbox Calculate Qualitative Ranges in the Behavior Tab has to be activated). For a flawless display, the first range should be assigned the smallest value, and the third range the greatest value. If the ranges are calculated, only the second range must be specified; first and third range will be automatically determined according to the percentages specified in Percentage for Qualitative Range 1 and 3 (see also Behavior Tab). |
|
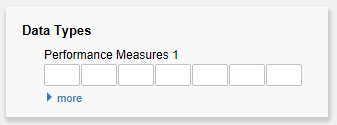
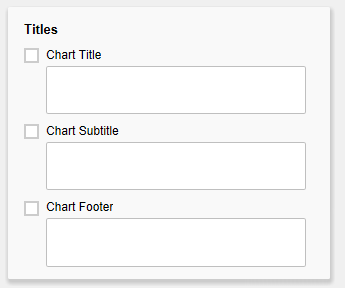
Data TypesA data type can be specified for each data point of a Data Series. By default, only the input options for Performance Measure 1 are visible. The input options for all other Data Series can be made visible by clicking on "more". The entered data types must be defined on the Data Types tab. The definition of the data types can also be made in the graphomate charts or graphomate tables. Data types are defined globally; they are valid for all graphomate components. Chart TitleEnter a title for your bullet graph at this point. If the Checkbox is activated, the Chart Title will be shown. Line breaks are adopted. Chart SubtitleEnter a subtitle for your bullet graph at this point. If the Checkbox is activated, the subtitle will be shown. Line breaks are adopted. Chart FooterEnter a footer text for your bullet graph at this point. If the Checkbox is activated, the footer will be shown. |
|