Skip to end of metadata
Go to start of metadata

You are viewing an old version of this page. View the current version.

Compare with Current View Page History

Version 1 Current »


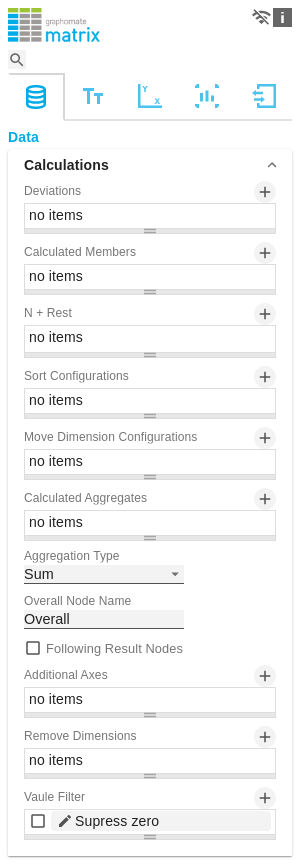
Calculation

Deviations

This property can be used to calculate deviations. It is a list, where each individual item represents the calculation of a new deviation member. The variances are calculated as follows:

Absolute: Minuend - Subtrahend
Percentage: (Minuend - Subtrahend) / |Subtrahend|

Please note: At this point the values for deviations are only calculated. You have the possibility to visualize these calculated values on the tab "Chart Specific".

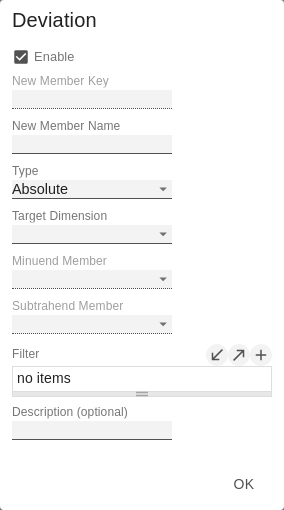
Deviations Pop-Up

You can create new variances using the  sign. Each configuration has the following properties:

  • New Member Name: The unique name of the newly calculated member that is displayed in the table.
  • Type: Either Absolute or Percent. Defines whether an absolute or relative deviation is calculated.
  • Target Dimension: The dimension in which the new, calculated deviation member should be inserted - e.g. "measures".
  • Minuend Member: The member that is to serve as a minuend, e.g. an actual value.
  • Subtrahend Member: The member that is to serve as subtrahend, e.g. a value from the previous year.
  • Filter (optional): A list of filter objects. Each filter object can restrict a dimension to certain members. Only deviation data points are created that correspond to the filter conditions.
  • Description: Short name that describes the configuration to be recognizable e.g. "abs"

Calculated Members

Calculate additional columns, rows or members using formula input.

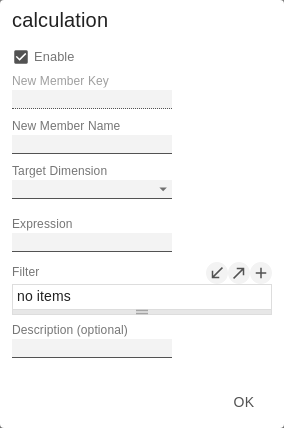
Calculated Members Pop-Up

You can create new calculated members using the  sign. Each configuration has the following properties:

  • New Member Name: The unique name of the newly calculated member that is displayed in the table.
  • Target Dimension: The dimension in which the new, calculated member should be inserted - e.g. "measures".
  • Expression: An expression to be evaluated for each calculated data point. Here, the keys of members of the dimension are encapsulated in curly brackets with leading $. (e. g. ${member1}). This results in the following possibilities, for example::
    • Ratio of two members: ${member1}/${member2}
    • Conversion of working hours into working days: ${workinghours} / 8
    • Calculation of new measures: ${Sales}-${Costs}

      You can find a detailed description of the syntax here

  • Filter (optional):  A list of filter objects. Each filter object can restrict a dimension to certain members. Only calculated member data points are created that correspond to the filter conditions.
  • Description (optional):  Short name that describes the configuration to be recognizable e.g. "abs"

N + Rest

Define how many elements should be mapped as Top N or Bottom N with Rest representation.

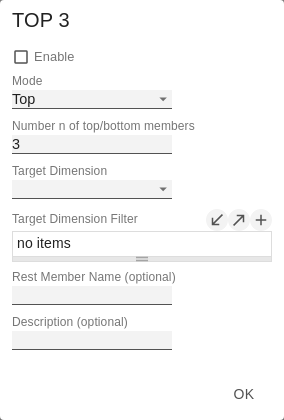
N + Rest Pop-Up (Top 3)

You can create new groups for N + rest using the  - sign. Each configuration has the following properties:

  • Enable: Applies the N + Rest Confuration, when enabled.
  • Mode: Choose between Top (top) and Bottom (bottom).
  • Number n of top/bottom members: Define the number of top/bottom elements.
  • Target Dimension: The dimension into which the new top/bottom member should be inserted - e.g. "measures".
  • Target Dimension Filter (optional): Here you filter which members of other column dimensions should affect the ranking. If there is more than one column member and there is no filter defined, the ranking of a row is based on the sum of all columns.
  • Rest Member Name (optional): Sets a label for the rest member.
  • Description (optional): Short name describing the configuration to be recognizable.

Sort Configurations

Here you can sort members of dimensions. Measures are also interpreted as a dimension and can be sorted accordingly.
In future versions we will extend these options.

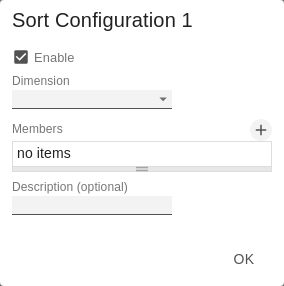
Sort Configurations Pop-up

You can use the  sign to create a new sort order for a dimension. Each configuration has the following properties:

  • Dimension: A dimension the members of which should be sorted.
  • Member: Here you can use drag and drop to sort the members of a dimension or measures.
  • Description: Short name describing the configuration to be recognizable

Move Dimension Configurations

This makes it possible to swap dimensions in the header or move them to another dimension. To do this, a configuration must be created using the sign.
In the dialog, you can then select which dimension should be affected, whether it should appear in the columns or rows, and on which level of the hierarchy it should land.

Calculated Aggregation

You can create aggregations that differ from the standard for certain dimensions. Use this, for example, to create a different aggregations for each column.

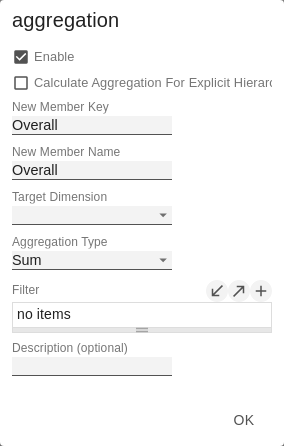
Calculated Aggregation Pop-Up

You can use the sign to create a new aggregation. Each aggregation configuration has the following properties:

  • New Member Name: The unique name, of the newly aggregated aggregation member, that will be displayed in the table.
  • Target Dimension: The dimension into which the new aggregation should be inserted - e.g. "measures".
  • Aggregation Type: You can choose between Sum (Sum), Minimum (Min), Maximum (Max), Count (Count) and Mean (Mean).
  • Filter (optional): A list of filter objects. Each filter can restrict a dimension to specific members. Only data points are created which match the specified members for the dimensions selected in the filter.
  • Description (optional): Specifies a descriptive short name for the set configuration.

Aggregation Type

The graphomate matrix calculates aggregations for displaying hierarchy nodes, if the host environment doesn’t provide them.
Here you select the type for the aggregations. You can choose between sum (Sum), minimum (Min), maximum (Max), arithmetic mean (Mean), geometric mean (Geometr. Mean), count (Count), empty (Null) and no aggregation (None). This feature, not to be confused with Calculated Aggregations, is much simpler and creates the chosen Aggregation Type for all columns.

Aggregation Node Name

At this point, a separate name can be assigned to the aggregation elements - e.g. "Sum" or Total" or also "Europe".

Following Result Nodes

Change the position of the totals to precede or follow its child nodes.

Additional Axes (formerly Hyper Axis) Config

New hyper axes can be created here. These are additional axes of the data projection (in addition to the known Columns and Rows axes of a normal, two-dimensional projection). This allows multiple data values to be assigned to a cell of the matrix to display in-cell visualizations, like sparklines, from multiple values.

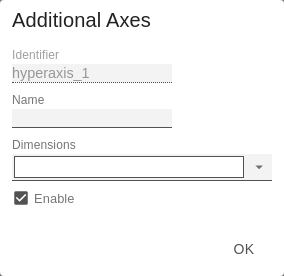
Additional Axes (formerly Hyper Axis) Config Pop Up

You can create new hyper axes using the - sign. Each configuration has the following properties:

  • Name: the name of the axis. It can be selected in hyper features such as sparklines to specify which axis to visualize.
  • Dimensions: Dimensions assigned here will be moved from the default Rows or Columns axis to the hyper axis.
  • Enable: Sets whether the axis configuration should be applied.

Remove Dimension

A configuration can be created by clicking in the field. The dimension to be removed can then be selected in the dialog.

Value Filter

The value filter can be used to remove values from the outline using logical operators. These are then also removed from the totals.

  • != means not equal to
  • Treat null as 0 forces a zero on empty values

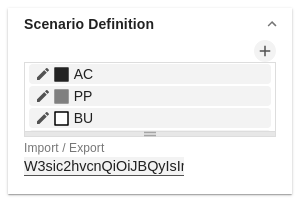
Scenario Definition

This property determines the appearance of the scenarios - also known as Data Types. 
The four standard scenarios of the International Business Communication Standards are already defined, but can also be adapted.
You can create new scenarios using the  sign. 

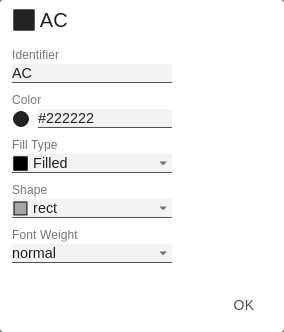
Scenario Definition Pop-Up

Each scenario has the following characteristics:

  • Identifier: A character string (such as AC) that can be used to reference the scenario - for example, in the Scenario Assignment below, for bar, pin, and background bars or their axes - see the tab "Chart Specific".
  • Color: Here you can define the color using the color picker or enter a HEX, RGB or HSL code. You can switch these using the small arrows on the right side of the color picker.
  • Fill Type: You can choose from the following fill patterns: Filled, without filling (Empty), hatching down (Hatched Down), hatching thick down (Hatched Down Bold), hatching up (Hatched Up), hatching thick up (Hatched Up Bold), and dotted (Dotted).
  • Font Weight: Choose between normal or bold font size for this scenario.

Import/Export

Copy this string to use scenarios in other graphomate components.

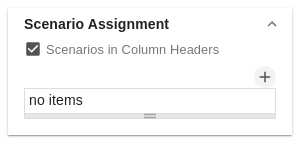
Scenario Assignment

Scenarios in Column Headers

This property ensures that the scenarios are displayed as bars below the column headers.

You can use the  sign to create assignments of scenarios to dimension members

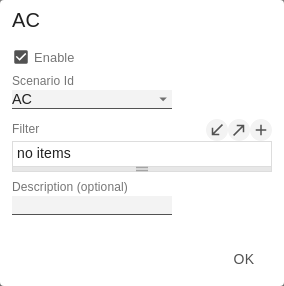
Scenario Assignment Pop-Up

This property assigns scenarios to data cells.

Each configuration has the following properties:

  • Scenario Id: The ID of the scenario to be used. A scenario ID used here, has to be defined in the scenario definition.
  • Filter: The selected scenario is assigned for each dimension member that is selected here using the  sign.
  • Description: Short name describing the configuration to be recognizable.


Data Selection

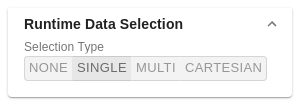
Selection Type

Specify how cells can be selected by the user. The following modes are available:

  • None: Cells can not be selected.
  • Single: Only a single cell can be selected at the same time
  • Multi: multiple cells can be selected using the CTRL key.

License

License Key 

Enter the license key here. 

Entering the license key is only necessary in the versions for MS365 and Tableau.

  • No labels