Quick Start
- Stefanie Schröder (Unlicensed)
- Daniel Molkentin
You have imported a data source into your project and now want to visualize your data using graphomate bubbles for Lumira Discovery.
1. Select "gm bubbles" from the chart picker's extension tab.
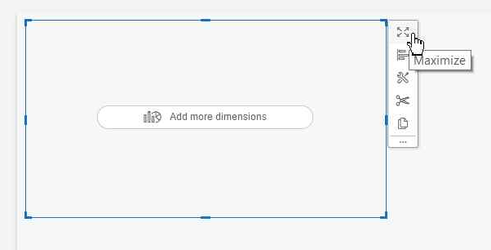
2. Select the newly created component in your design area and click on "Maximize".
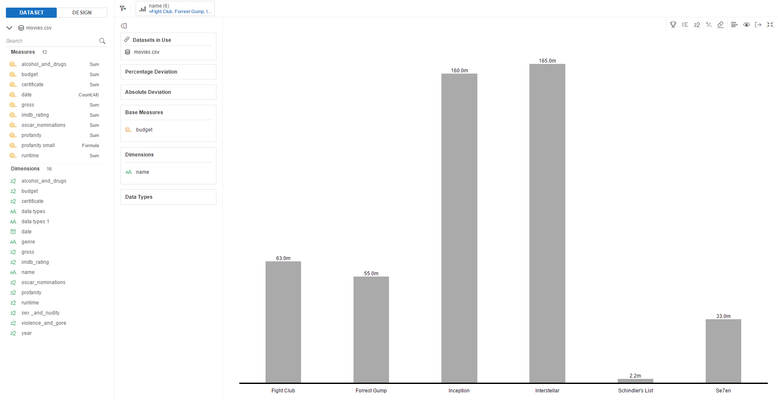
3. Now you can drag&drop at least one dimension to the Dimensions feed and at least one measure to the Base Measures feed.
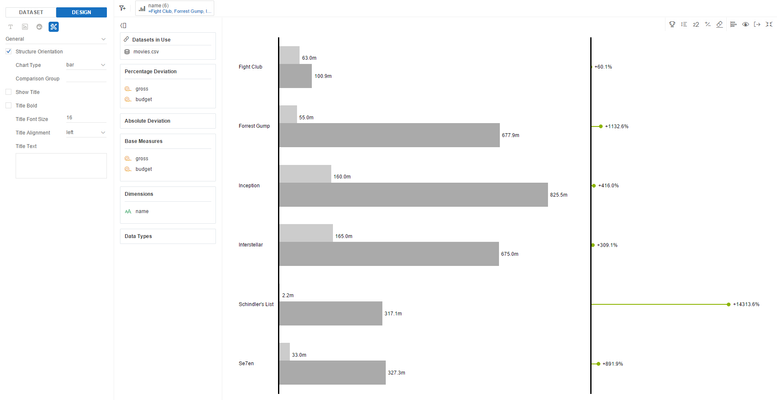
3. You can drag two comparable measures to a deviation feed to create a deviation chart. You can also drag additional measures to the Base Measure feed.
4. By switching to the Design tab you are able to change the chart's properties like changing the orientation from temporal to structural. Select the "tool" icon on the design tab to access the property editor. Then use the drop down menu to navigate to different property categories.