Introduction
- graphomate Team
- Stefanie Schröder (Unlicensed)
Slope graphs were established at the beginning of the eighties by Edward Tufte in his standard work "The Visual Display of Quantitative Information". Just as its alternative designation - table-chart - the name gives a good impression of what is at stake with slope graphs: The data is shown as in a table, but in such a way that numerical values must not be "read", but visually interpreted.
This is the original table-Chart on pages 158-159 of Edward Tufte:
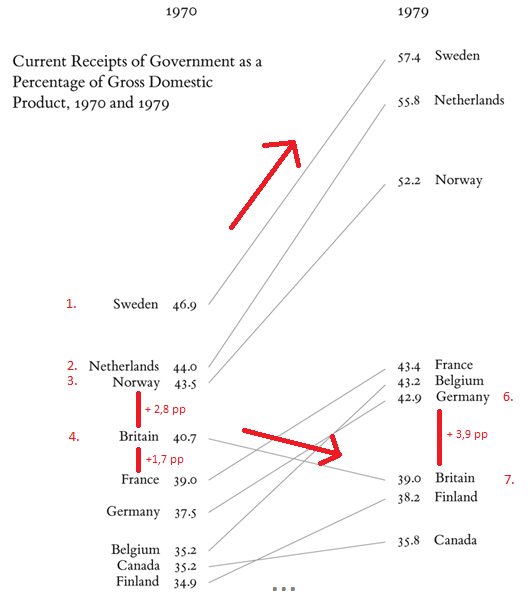
The minimalistic figure of the percentage share of state revenue in gross domestic product can be interpreted both vertically and horizontally: For the two years, the order of countries is recognizable at a glance. Furthermore, the change in the shares from 1970 to 1979 can be interpreted visually via the gradient - or slope - of the connection line between the annual values.
By means of the slope graph, a higher visual density is made possible and more context shown. Information can be transported with little space requirement, without making intelligibility more difficult. Through visualization of values over two years, the development is shown and change of ranges is visually, easily comprehensible.
With graphomate slopegraphs, the two columns cannot only be represented but arbitrarily many can be mapped. The so-called Bump Charts - slope graph, which directly maps the rank, can be highlighted: 1st, 2nd, 3rd position … - can be created with a mouse click. Through highlighting for runtime, positions can be highlighted; an image export (PNG) enables further use of the slope graphs in other media.
In the sense of a uniform language regulation we speak in the further manual of Lumira Designer or briefly designer. Our products are still compatible with SAP Design Studio 1.6.
For our graphomate slopegraphs extension Design Studio 1.6 SP06 or higher or Lumira Designer >= 2.0 and IE 11+ are required. For further information, for example about the deployment on the Business Intelligence Platform (BIP) or SAP Netweaver, please consult the Product Availability Matrix (PAM). Please note that from 2017, we will no longer support Internet Explorer 9 and 10.