en Quickstart (SAC)
- Lars Schubert
- Alexander Widdecke
The new Overlay User Interface of the graphomate products
After you have added the graphomate widget to the SAC canvas in edit mode via Add > Custom Widgets, a small landing page appears that tells you to first assign a data model to the custom widget and the model selection dialogue opens.
The document icon ![]() opens this manual for the graphomate charts; the gear wheel
opens this manual for the graphomate charts; the gear wheel ![]() opens the graphomate property sheet (GPS).
opens the graphomate property sheet (GPS).
With this you already use our new Overlay User Interface (UI): as soon as you drag the mouse over the graphomate charts while working, this new menu appears:
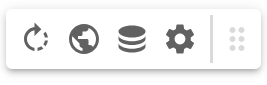
By means of the Overlay UI you get faster access to important functionalities of the graphomate custom widgets in the SAC, as well as in the other BI frontends we support, such as Power BI or Tableau. You will now find this overlay UI in all graphomate custom widgets and we will extend its functionality with the next releases.
The dots let you move the overlay UI around.
The gear wheel ![]() takes you directly to the graphomate property sheet (GPS), where you can make all settings for the graphomate charts.
takes you directly to the graphomate property sheet (GPS), where you can make all settings for the graphomate charts.
The database symbol ![]() leads you directly to the so-called data binding, where you select the characteristics/dimensions and key figures that you want to map with the graphomate charts. Please note that the first step is always to assign SAC data to the graphomate custom widgets.
leads you directly to the so-called data binding, where you select the characteristics/dimensions and key figures that you want to map with the graphomate charts. Please note that the first step is always to assign SAC data to the graphomate custom widgets.
Via the world icon ![]() you can make some basic settings for the graphomate charts and via the arrow
you can make some basic settings for the graphomate charts and via the arrow ![]() you can rotate the chart by 90 degrees.
you can rotate the chart by 90 degrees.
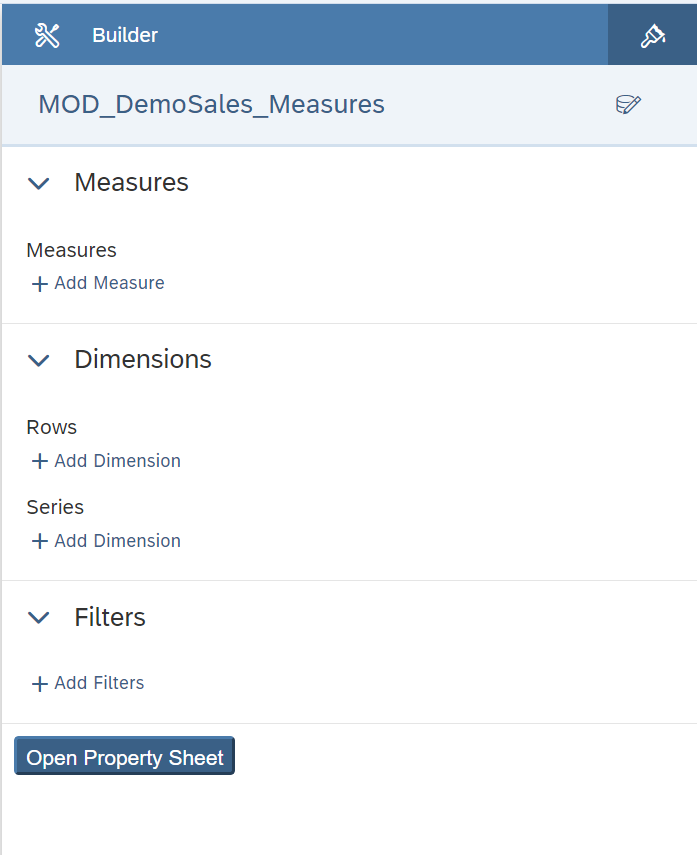
Data BindingMeasuresDetermine which measures should be depicted within the chart. Now you can also create Calculated Measures within the dialogue. RowsDefine here which dimension determines the category (X)-axis for the charts or rows for the matrix. SeriesHere you can generate several series of the above selected measure by means of a dimension - according to the characteristics of the dimension. Use this option, for example, to "break down" the key figure "Sales" according to actual and planned values by entering the dimension for scenarios here. FiltersYou can define (background) filters for dimension values here. You can now filter within hierarchies and exclude members. Open Property SheetThis button opens our component menu, called the graphomate property sheet (GPS). |
|
|---|