 graphomate for UI5 Quick Start
1. Installation
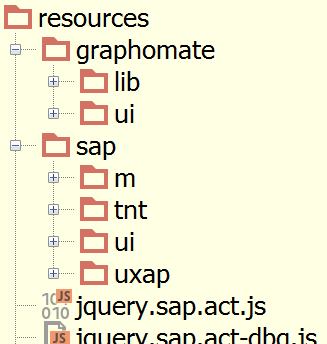
Copy the graphomate library file's graphomate folder into your UI5 resource directory. The resulting directory tree should look like this:
2. Inclusion
To include the graphomate libraries just bootstrap them like any other UI5 library:
Local UI5 Bootstrap Expand source
<script src="openUI5/resources/sap-ui-core.js"
    type="text/javascript"
    id="sap-ui-bootstrap"
    data-sap-ui-libs="
        sap.ui.layout,
        sap.m,
        graphomate.ui.charts"
></script>
Remote UI5 Bootstrap Expand source
<script
    src="https://openui5.hana.ondemand.com/resources/sap-ui-core.js"
    data-sap-ui-resourceroots='{"graphomate": "./resources/graphomate/"}'
    type="text/javascript"
    id="sap-ui-bootstrap"
    data-sap-ui-libs="
        sap.ui.layout,
        sap.m,
        graphomate.ui.charts"
></script>
Currently available libraries:
- graphomate.ui.charts
- graphomate.ui.tables
3. Usage
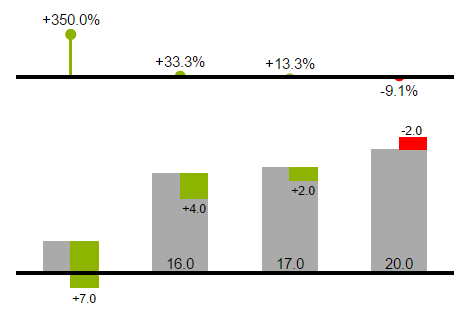
graphomate.ui.charts Example Expand source
var chart = new graphomate.ui.charts.Chart({
   chartType: graphomate.ui.charts.enums.ChartType.OffsetBar,
   series1: [5, 16, 17, 20],
   series2: [-2, 12, 15, 22],
   deviations: [
      new graphomate.ui.charts.Deviation()
   ]
});
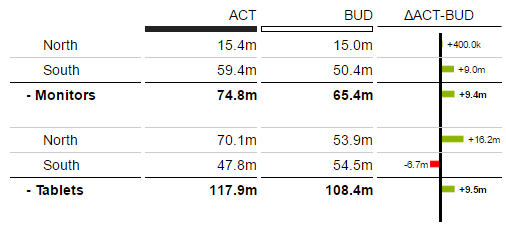
graphomate.ui.tables Example Expand source
jQuery.sap.require("graphomate/ui/DatatypeDictionary");
jQuery.sap.require("graphomate/ui/tables/Table");
jQuery.sap.require("graphomate/ui/tables/enums/RowOrder");
jQuery.sap.require("graphomate/ui/enums/DeviationType");

var dtd = new graphomate.ui.DatatypeDictionary();

var table = new graphomate.ui.tables.Table({
  width: "500px",
  rowOrder: graphomate.ui.tables.enums.RowOrder.PostOrder,
  showSumBorders: true,
  sumPadding: 1.5,
  rows: [
    new graphomate.ui.tables.Row({
      title: "Monitors",
      hierarchyLevel: 0,
      dataPerColumn: [74800000, 65400000]
    }),
    new graphomate.ui.tables.Row({
      title: "North",
      hierarchyLevel: 1,
      dataPerColumn: [15400000, 15000000]
    }),
    new graphomate.ui.tables.Row({
      title: "South",
      hierarchyLevel: 1,
      dataPerColumn: [59400000, 50400000]
    }),
    new graphomate.ui.tables.Row({
      title: "Tablets",
      hierarchyLevel: 0,
      dataPerColumn: [117900000, 108400000]
    }),
    new graphomate.ui.tables.Row({
      title: "North",
      hierarchyLevel: 1,
      dataPerColumn: [70100000, 53900000]
    }),
    new graphomate.ui.tables.Row({
      title: "South",
      hierarchyLevel: 1,
      dataPerColumn: [47800000, 54500000]
    })
  ],
  columns: [
    new graphomate.ui.tables.DataColumn("column-act",{
      title: "ACT",
      datatype: "AC"
    }),
    new graphomate.ui.tables.DataColumn("column-bud",{
      title: "BUD",
      datatype: "BU"
    }),
    new graphomate.ui.tables.DeviationColumn({
      type: graphomate.ui.enums.DeviationType.Absolute,
      title: "\u0394ACT-BUD",
      measureColumnId: "column-act",
      baseColumnId: "column-bud"
    })
  ]
});