Table
- Tim Schauder
- Fynn Grandke (Unlicensed)
Class graphomate.ui.tables.Table
extends sap.ui.core.Control
Quick Start
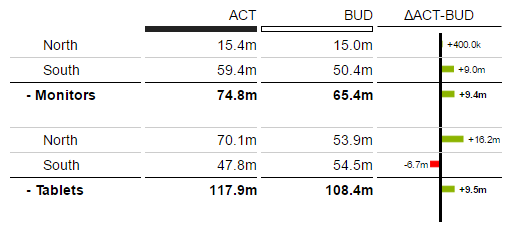
Creates a table that can be used in layouts and other container components. The graphomate table is highly customizable due to its large amount of properties and aggregations.
The Following Properties are available:
| Property Name | Type | Description |
|---|---|---|
width | sap.ui.core.CSSSize | Sets the width of the table. Allowed values are CSS sizes like "250px", "10em", "50%" or "auto". |
| height | sap.ui.core.CSSSize | Sets the height of the table. Allowed values are CSS sizes like "250px", "10em", "50%" or "auto". Note that when a percentage value is given, the height of any of the surrounding containers must be defined. This is due to the characteristic of the html elements' height attribute which differs from the behavior of the width attribute for percentage values. |
| rowOrder | graphomate.ui.tables.enums.RowOrder | Controls the position of totals in a table with hierarchical data. The value PreOrder sets totals as preceeding rows and PostOrder sets them as following ones. |
| showDatatypesInCells | boolean | Sets the color of the data column's datatype for all cells of the column and overrules all other color settings. |
| showDatatypesInHeader | boolean | If set to true, the table header of a column is styled according to its assigned datatype. |
| fixedHeader | boolean | If the table header (column titles) should be displayed permanently (even when scrolling), this can be done by activating this property. |
| showFilterHelper | boolean | If this property is activated, a text field appears in the upper left corner of the table. The value of this text field will be used to set a live filter on the row titles. |
| comparisonGroup | string | Setting the comparison group string makes other tables with the same comparison group string to scale identically. Comparison Groups are used globally within the DOM. Also charts with the same comparison group are scaled identically. |
| manualScaleMax | graphomate.ui.types.PositiveFloat | Sets the maximum data value for scaling the absolute deviation columns. |
| manualScaleMin | graphomate.ui.types.NegativeFloat | Sets the minimum data value for scaling the absolute deviation columns. |
| manualScalePercentMax | graphomate.ui.types.PositiveFloat | Sets the maximum data value for scaling the percent deviation columns. |
| manualScalePercentMin | graphomate.ui.types.NegativeFloat | Sets the minimum data value for scaling the percent deviation columns. |
| scaleMode | graphomate.ui.enums.ScaleMode | The value Auto scales the table according to the min and max values of all data. The deviation columns of several tables can be scaled identically by using the same comparison group. That way the min and max of the data basis in this group is used. With the scale mode Manual the table will use the assigned manual min and max values for scaling. |
| semanticAxis | boolean | If set to true, the axis of deviation columns is styled according to the datatype assigned to the data column that serves as base for the deviation calculation. |
| axisWidth | graphomate.ui.types.UnsignedInteger | Sets the width of deviation axes in px. |
| deviationGoodColor | graphomate.ui.types.HexColor | Sets the color of positive deviations. |
| deviationBadColor | graphomate.ui.types.HexColor | Sets the color of negative deviations. |
| negativeDeviationIsGood | boolean | If activated, the colors of negative and positive deviations are swapped. |
| showDeviationLabels | boolean | Sets the visibility of deviation labels. |
| textualDeviation | boolean | If activated, the deviations are represented only by their labels and no deviation bars or pins are displayed. |
| outlierMode | graphomate.ui.enums.OutlierMode | Sets the style of outliers. Outliers are values which exceed the range defined by the (manual or automatic) minimum and maximum value of a table's scale. |
| pinColor | graphomate.ui.types.HexColor | Sets the color of the pins. Pins are the lines of a percentage deviation column which connect the axis with the pin head and represent the displayed values with their length. To apply, the property applyPinColor must be activated. |
| applyPinColor | boolean | If activated, the property pinColor will be applied. |
| pinHeadColor | graphomate.ui.types.HexColor | Sets the color of the pin heads. A pin head marks the end of a deviation column's pin. To apply, the property applyPinHeadColor must be activated. |
| applyPinHeadColor | boolean | If activated, the property pinHeadColor will be applied. |
| deviationLabelSizeFactor | graphomate.ui.types.PositiveFloat | According to IBCS the text size of the labels in the deviation columns corresponds to the text size of the data columns of the table. The default factor for this is 0.7, that means the table’s text size times 0.7 results in the text size of the deviations. This factor can be changed with this property. Please be aware that a factor lower than 0.3 or higher than 1.2 may result in wrong representations. |
| noClip | boolean | This option disables clipping for SVGs, a feature used to prevent pin heads to show up behind both sides of a deviation axis. This behaviour is not recommended, but necessary if you plan to deploy your table on iOS: Newer Safari versions contain a bug and therefore do not support clipping, which leads to rendering errors. |
| showDividers | boolean | Sets the visibility of the lines which divide the rows from each other. |
| dividerColor | graphomate.ui.types.HexColor | Sets the color of the lines which divide the rows from each other. |
| dividerThickness | graphomate.ui.types.PositiveFloat | Sets the thickness of the lines which divide the rows from each other. The value is interpreted as em. |
| showSumBorders | boolean | Sets the visibility of sum borders. The sum borders will be displayed above the sum rows. |
| sumBorderColor | graphomate.ui.types.HexColor | Sets the color of sum borders. |
| sumBorderThickness | graphomate.ui.types.PositiveFloat | Sets the thickness of sum borders in em. |
| sumPadding | graphomate.ui.types.PositiveFloat | Adds a padding after sum rows. The padding is interpreted as em. This is useful when rowOrder is set to "PreOrder" to separate rows of the same hierarchy level from each other. |
| fontSize | graphomate.ui.types.UnsignedInteger | Sets the table's font size in px. |
| fontFamily | string | Sets name of the table's font family. |
| fontColor | graphomate.ui.types.HexColor | Sets the color of the table's font. |
| rowTitleAlignmentRight | boolean | If activated, the row title texts are aligned at the right side of their cell. |
| dataCellAlignmentRight | boolean | If activated, the values of data columns are aligned at the right side of their cell. |
| basicNumberFormat | string | Sets the format of the absolute values according to the guidelines of numeral.js. e.g. "0.00a" for abbreviated values with two decimal places like 2.69k |
| basicNumberFormatPercent | string | Sets the format of the percentage values according to the guidelines of numeral.js. e.g. "0.0%" for percentage values with one decimal place like 10.4% |
| locale | graphomate.ui.enums.Locale | Sets the region specific locale. The locale affects decimal and thousand separators of the basic number format as well as abreviations and enumerations. |
| labelFormatMode | graphomate.ui.enums.LabelFormatMode | In basic mode the table uses the number formats defined by the properties "basicNumberFormat" and "basicNumberFormatPercent". In extended mode it applies the definition of aggregation elements "extendedNumberFormat" and "extendedNumberFormatPercent" to all texts. |
| showColumnTitles | boolean | Sets the visibility of the column header titles. |
| showRowTitles | boolean | Sets the visibility of the row titles. |
| noWrap | boolean | If activated, column titles and row titles are not wrapped when they are wider than their column's width. |
| zeroValueReplacement | string | If this property contains a value, all zeros (0) will be replaced with that value. |
| infinityValueReplacement | string | In JavaScript, when you divide any number by 0, the result is Infinity. If this property contains a value, all '∞' values are replaced with that value. Infinity values may be displayed at percentage deviation columns when the base of the deviation contains 0. |
| hierarchyIndent | graphomate.ui.types.PositiveFloat | Sets the indent size of the hierarchy levels in em. |
| collapsibleHierarchy | boolean | If activated, the hierarchy nodes are collapsible and expandable and their hierarchy state markers (+,-) are displayed to click on them. |
| nodeStyleBold | boolean | Sets whether the hierarchy node rows' texts should be bold. |
| nodeStyleItalic | boolean | Sets whether the hierarchy node rows' texts should be italic. |
| nodeStyleColor | graphomate.ui.types.HexColor | Sets the color of the hierarchy node rows' texts. |
| hierarchyExpansionLevel | graphomate.ui.types.UnsignedInteger | Determines to which hierarchy level the table is initially expanded when rendering. The hierarchy level index starts with 0 (highest level). When the table contains exactly one row of hierarchy level 0 and an arbitrary amount of rows of other levels, the hierarchy structure is called a tree. A hierarchy with multiple top level nodes is called forest. When having a tree structure, a value of 0 for this property will initially render the top level node as collapsed. A forest will need a value of 1 for this property to display the top level nodes as collapsed due to internal hierarchy logic. In this case, a value of 0 would result in an empty table. |
| expandOnRowTitleClick | boolean | If activated, the hierarchy nodes can be collapsed and expanded by clicking on them instead of clicking on their hierarchy state marker (+,-) and the + and - won't be displayed. |
| exceptionPosition | graphomate.ui.tables.enums.ExceptionPosition | Determines whether the exceptions of a RowFormatConfiguration are displayed at the left side of the cell, at the left side of the value or at the right side of the value they get applied to. |
The following aggregations are available:
| Aggregation Name | Aggregated Object Type | Cardinality | Description |
|---|---|---|---|
rows | graphomate.ui.tables.Row | 0...n | A list of Row instances which provide information like hierarchy level, row title and the actual data of the row. When using rows of multiple hierarchy levels, the order of rows in this aggregation must be post order or pre order. This is necessary for the table to build a nested hierarchy from the flat aggregation list. For pre order the following order is valid (described schematically, starting at top level node with hierarchy level 0): [0,1,1,0,1,1]. A non valid order would be [1,0,1,1,0,1,1]. |
columns | 0...n | A list of objects which are based on graphomate.ui.tables.AbstractColumn. Column objects are not essential to render a table, because the actual data is defined by the rows, but they provide information like the title, width, datatype or deviation type of a column. As Column objects do not describe the actual data reordering them will only affect column titles, datatypes and other column attributes. Defining Column objects is recommended because their Ids are used to reference columns in deviation calculations or row format configurations. | |
| extendedNumberFormat | graphomate.ui.ExtendedNumberFormat | 0...1 | The item of this aggregation allows you to configure the formatting of absolute values within the table. It gets applied in extended number formatting mode (property "labelFormatMode"). |
| extendedNumberFormatPercent | graphomate.ui.ExtendedNumberFormat | 0...1 | The item of this aggregation allows you to configure the formatting of percentage values within the table. It gets applied in extended number formatting mode (property "labelFormatMode"). |
| rowFormatConfigurations | graphomate.ui.tables.RowFormatConfiguration | 0...n | The RowFormatConfigurations of this aggregation define dynamic data driven rules which get applied when their condition is met. The rules can apply a special styling, datatype, number format or css statement. |
Event Details
The following methods exist for each event "sampleEvent":
- attachSampleEvent(function) - Registers a listener function for the event at the Table.
- detachSampleEvent(function) - Deregisters the passed listener function for the event from the Table.
elementClick(oEvent)
This event is fired when the user clicks a data cell of the table. Cells of deviation columns are not supported. By using oEvent.getParameter(parameterName) you can access the event's parameters. oEvent.getParameters() returns an object containing all available event parameters.
The following parameter names are available for this event:
- {string} 'id' - The id of the table which fired the event
- {boolean} 'altKey' - Whether the alt key was pressed
- {boolean} 'shiftKey' - Whether the shift key was pressed
- {boolean} 'ctrlKey' - Whether the ctrl key was pressed
- {graphomate.ui.tables.Row} 'row' - The row the clicked cell belongs to
- {graphomate.ui.tables.DataColumn} 'column' - The column the clicked cell belongs to.
- {float} 'value' - The value of the clicked data cell. Conveniently this value is read from the clicked row's property "dataPerColumn"