Introduction
- graphomate Team
- Stefanie Schröder (Unlicensed)
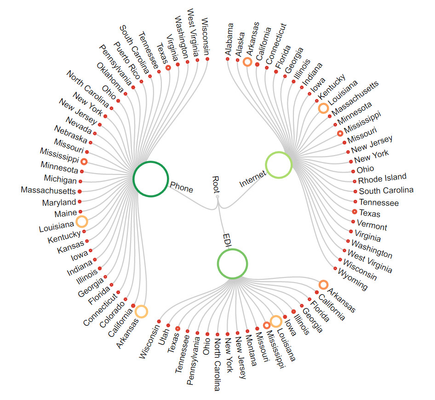
Trees or even tree diagrams are a way of representation of hierarchies with size-based visualization in which rankings are recorded quickly. Each tree begins with the root as the starting point and branches to other branches via nodes, where the size of a node represents the sum of its subnodes. Further information can be represented through color shades and particularly kept in view.
Note:
Please note that for reasons of performance as well as of perception, it makes no sense to represent more than 1,000 nodes in visualization at the same time. Should you have this request, then we recommend working with a second detail visualization that represents additional information upon user request, with the help of the script language.
For the representation capable hierarchies, the same restrictions apply, as is the case of graphomate tables.
In the sense of a uniform language regulation we speak in the further manual of Lumira Designer or briefly Designer.
For our graphomate trees extension Lumira Designer >= 2.0 SP03 and IE 11+ are required. For further information, for example about the deployment on the Business Intelligence Platform (BIP) or SAP Netweaver, please consult the Product Availability Matrix.
Please note that we will no longer support Internet Explorer 9 and 10 from 2017.