Properties
- graphomate Team
- Stefanie Schröder (Unlicensed)
- Gregor Große-Bölting (Unlicensed)
- Tim Schauder
Basically, you have two possibilities to update the properties of graphomate trees: Using the Standard Properties Sheet, that shows all the parameters in a structured list or via the Additional Properties Sheet. The latter offers a more user-friendly User Interface. However, some special properties can be updated only through the Standard Properties Sheet.
The check boxes  in front of properties in the Additional Properties Sheet are used to control the visibility of elements and activation of functions. The data source to be used can only be assigned via Drag&Drop to the component or to the Additional Properties Sheet under Data Binding.
Important: By pressing the F5 key, both the range of characters as well as the Additional Properties Sheet can be reinitialized. This is sometimes necessary when changes in the Properties are not adopted directly in the character range.
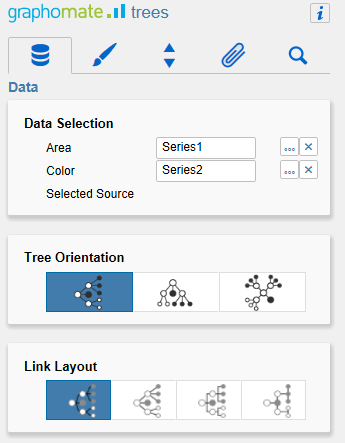
Data TabData SelectionFor the graphomate trees two data series can be configured, which respectively have different semantics:
In order for series to be able to be linked, a Data Source must first be selected. The series label (Series1, Series2) can be renamed via the input box and are displayed in the legend, the descriptions and Tool Tips. The blue box with the x deletes the assignment of data series. Tree OrientationUsing the Tree Type Option, it can be used to specify whether it is a vertical, horizontal or circular tree. The nodes, links and texts are arranged according to the setting. Link LayoutHere, you enter the Layout of the link between the nodes of the tree. The layouts curved, straight, "elbow" and cross are at disposal for selection. |
|
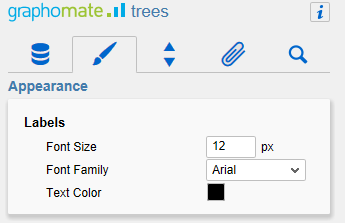
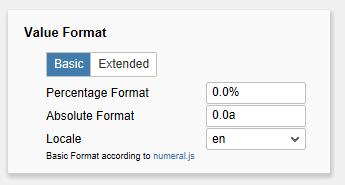
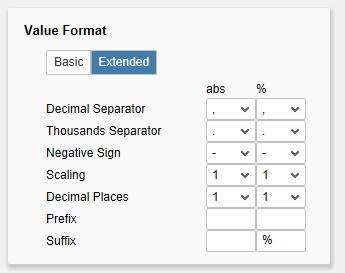
Appearance TabLabelsHere, you select the Font Size, the Font Family as well as the Text Color of rectangular labels. Value FormatSelect the format of the Trees values:
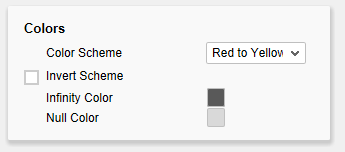
Set the property Use Formatted Data in the Standard Properties Sheet on true to use the formatting of the Data Source. The resulting "Format strings" can also be set via the script language (for this, see input options for the extended number format string in the general Manual). ColorsUse Color Scheme to set the desired color scale for a Tree. The default value is a transition from red via yellow to green. The scales hierarchy 1, 2 and 3 are particularly suitable for the representation of hierarchies. If the Invert Scheme check box is activated, the color scheme will be reversed. For example, this is useful when negative values should be represented as positive. Use Invert Scheme to revert the chosen color scheme. If e. g. the color scheme is Red to Yellow to Green and you check Invert Scheme, it will be changed to Green to Yellow to Red. The Infinity Color selected here is displayed when an infinite value results from the deviation calculation (e.g. due to division by 0). The Null Color set here will be displayed if no value can be derived from Color Series (e.g., when the depiction of the series is selected as calculation method although the series was not set). |
|
Behavior TabColor Calculation Based OnThe Color Calculation Method determines the manner in which the values of Color Series should be taken into account for the coloring of a Tree. The following values can be selected for the method:
HierarchyLimit Depth to Level defines up to which depth the tree shall be initially opened. Area Scale MethodScale From Zero specifies whether the value 0 is used as the smallest value for scaling the node area. This prevents the node with the smallest value in the data series from being displayed as a tiny dot. Otherwise, the smallest value from the data series is used, resulting in the corresponding node being displayed as a point (with the smallest displayable area). The Area Scale Method defines the method used for the scaling between the minimum and the maximum node size. In the case of linear scaling, the value range (minimum and maximum value from the data source) is depicted linearly on the minimum and maximum value of the node size, otherwise logarithmically. The logarithmic method allows a more pleasant, visual effect to be achieved for a very large difference within the range of values. By changing the Min and Max Node Radius of the node radius it is possible to influence the size of the nodes as already mentioned above. | 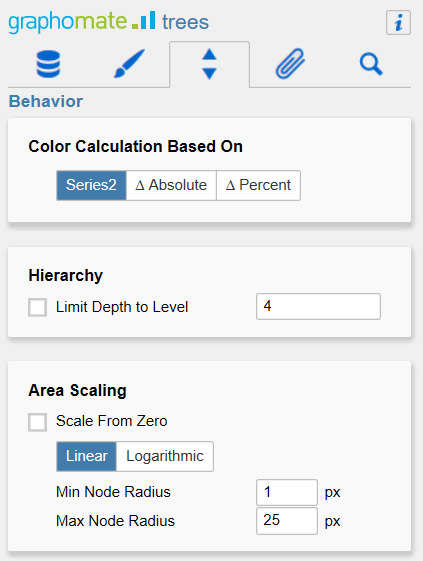 |
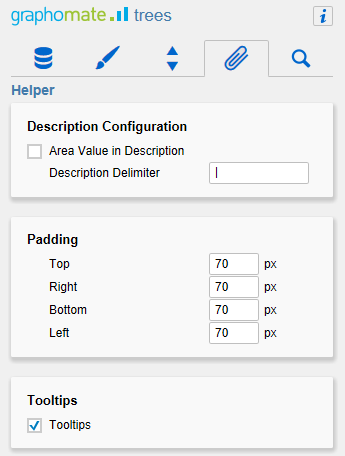
Helper TabDescription ConfigurationArea Value in DescriptionThis setting allows you be shown the value at the node besides the identifier of the characteristic. PaddingBy using the setting for Top, Right, Bottom and Left the side margins of the trees can be configured within the space available. Through this, it can be avoided that overhangs appear, which are not drawn at runtime and they make the tree appear truncated. TooltipsHere, you set whether at runtime Tooltips for the user should be displayed. Tooltips are displayed when hovering directly over the node and contain the identifier and the value of the node. |
Search TabAt this point you can search for the name, function or group of a property which are displayed at the Additional Properties Sheet. The appropriate settings are then displayed directly and can be changed here. | 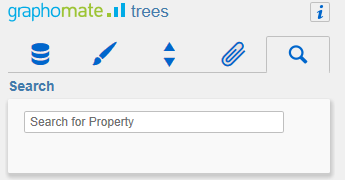 |
Info PopupAt this point, you will find information on the used version of the graphomate trees as well as a link with which you can inform us about errors and feature desires. Under credits, you will find an overview of the free libraries that we use. |  |