en GPS Tab8 Input Output (charts) LDE
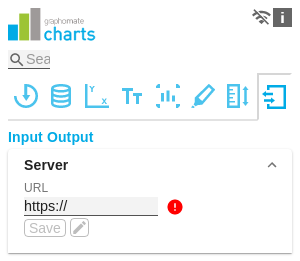
The functions of this tab are used to exchange templates for the graphomate charts. Connect to the graphomate server - a free component of graphomate GmbH - to store or load a graphomate charts template. This way you can exchange preconfigured graphomate charts designs between BI frontends that support the graphomate server. Currently these are: Tableau, SAP Analytics Cloud, SAP Lumira Designer, SAP Web Intelligence, SAP UI5 and Microsoft Excel.
Server ConfigurationHere you enter the URL of the graphomate server to which the component should connect and from which you want to save or retrieve templates. The hyperlink "Admin" allows you to jump to the admin area of the graphomate server. Due to subsequent restrictions of the Power BI environment for external visuals by Microsoft, the graphomate server is unfortunately no longer available here. However, templates can be made available via export/import. | |
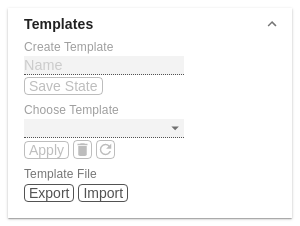
TemplatesIf the current settings are to be saved as a template, a new template name can be entered in the input field labeled Create Template and confirmed by clicking the Save State button. If the entered name complies with the naming convention, the template is saved on the server and a toast with the corresponding message is displayed in the lower part of the graphomate property sheet. However, if the entered name does not meet the expected naming conventions, an error message with the permitted characters is displayed accordingly. With Choose Template templates stored on the server can be retrieved and applied. To do this, the desired template must be selected and the Apply button must be pressed. If you want to delete a template, you have to select the template in the list and press the Delete (bin) button. If changes have been made to the templates on the server side, you have to click on the Refresh button. Changes should then be visible. | |
ExportPNG Export AvailableIf this Checkbox is activated, at runtime on mouse-over a camera icon is displayed next to the chart, which enables you to export the chart as a PNG file. Clicking on the button opens a new window in which the chart is displayed as an image that can be copied to MS office applications. Due to the export library, the title of the charts is not available in the PNG file. Excel Export AvailableIf this Checkbox is activated, at runtime on mouse-over an Excel icon is displayed next to the chart, which enables you to export the chart as a JSON file. Clicking on the button automatically copies the needed data into your clipboard and you will be notified that the export was successful. If the used browser does not support the automatic copying a new browser window will open. You can simply copy its content by marking the whole content (by clicking ctrl+a) and then copying to the clipboard manually (by clicking ctrl+c). After this you will be able to import the chart in Microsoft Excel (using the Import Chart-button) as long as you have installed the graphomate charts for Excel Add-in | |
Manual SeriesHere you can manually enter the data for the data series, which are then shown in the diagram. Please use the dot (.) as decimal separator. | |
Manual CategoriesHere you can enter category labels manually, which are then displayed in the diagram. Click on the desired level to enter a label for each element of the level. Level 1 corresponds to the first line of the category label and so on. |


