/
Using Different Scaling in Base Chart and Deviation
Using Different Scaling in Base Chart and Deviation
- Tim Schauder
Owned by Tim Schauder
This article describes how to define a manual scaling for the deviation chart and an automatic scaling for the base chart.
This requirement can’t be solved within a single chart. In a chart you can either define the scaling automatically or manually but you can’t define the absolute values to automatic scaling and the percent values to manual scaling. To meet this requirement you have to work with two charts.
Step-by-Step-Guide
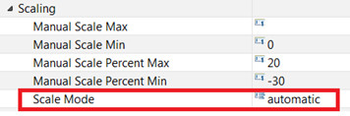
- Define one chart which shows the base chart without percent values. Define scale mode “automatic” in the corresponding property.
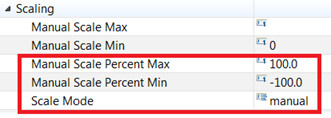
- Define another chart which doesn’t show the base chart but the percent deviations. Define scale mode to be “manual”, manual scale percent min to be “-100” and set manual scale percent max to “100” in the corresponding properties.
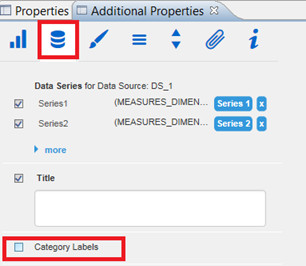
- Deactivate the category labels in Chart 2 (additional properties -> data -> category labels).
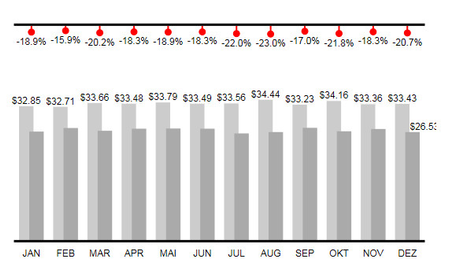
- Layer the charts as required (in the picture below chart 2 is arranged above chart 1). The percent values are now visualized in the range -100 – 100, absolute values are visualized in an automatic range, depending on the values delivered by the underlying DataSource.
Related Articles
Related content
Helper (charts)
Helper (charts)
More like this
Deviation
Deviation
More like this
Properties
Properties
More like this
Deviation Chart Is too Small
Deviation Chart Is too Small
More like this
en GPS Tab1 Start (charts) TBL
en GPS Tab1 Start (charts) TBL
More like this
Deviations (charts)
Deviations (charts)
More like this