/
Quick Start in Web Intelligence 4.3
Quick Start in Web Intelligence 4.3
- Stefanie Schröder (Unlicensed)
Owned by Stefanie Schröder (Unlicensed)
Jun 07, 2022
Analytics
Loading data...
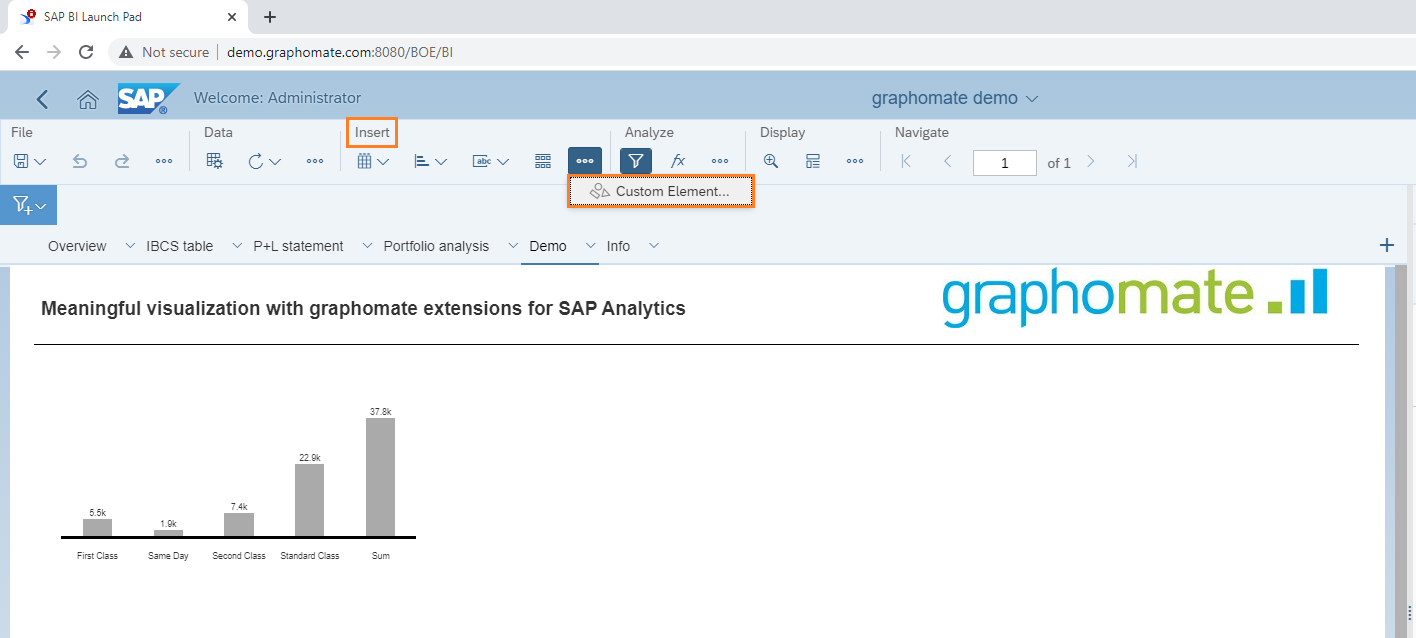
To create a new graphomate chart, graphomate table or graphomate bubbles, follow these steps in WebI:
- First, click "Custom Element".
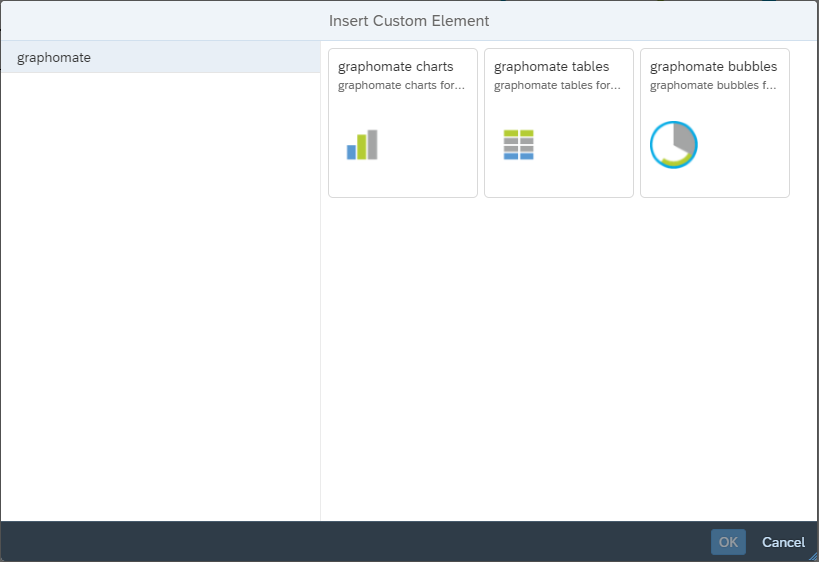
2. In the next dialog you got to choose which graphomate extensions you want to insert in the report
Then, click anywhere in the report. This is where the new element is inserted. Under options you are able to assign the data via drag and drop of the dimensions and measures.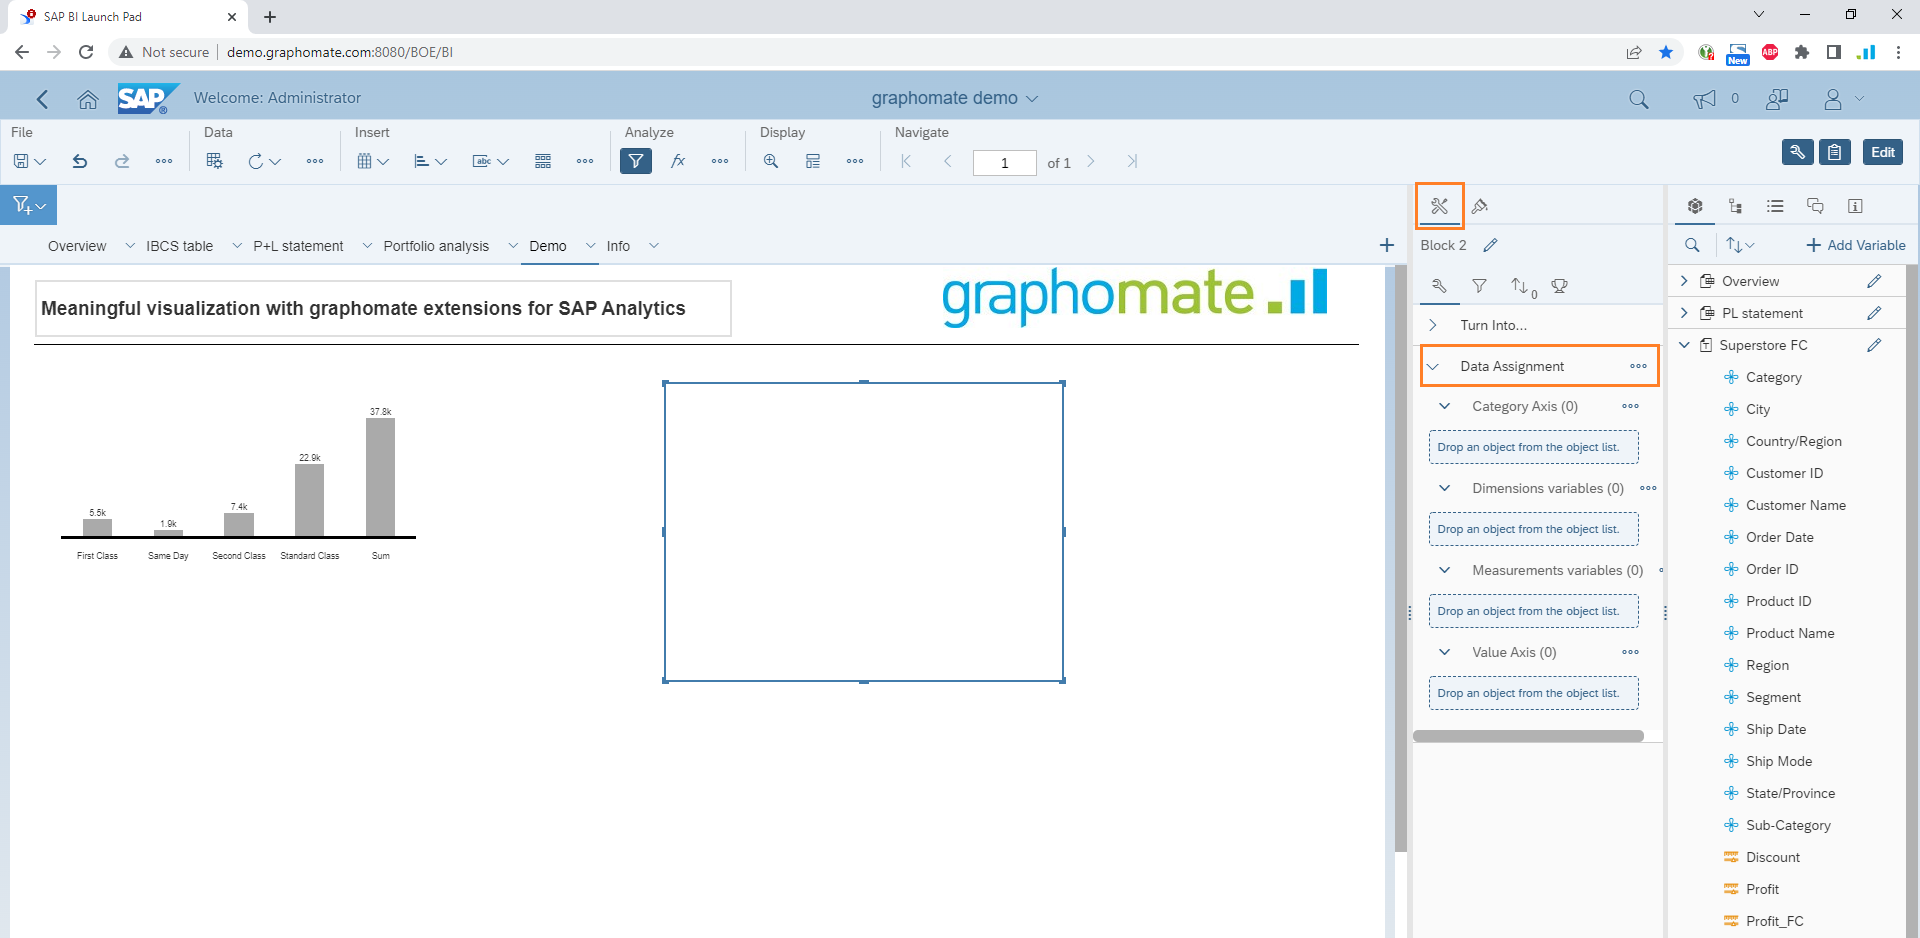
3.
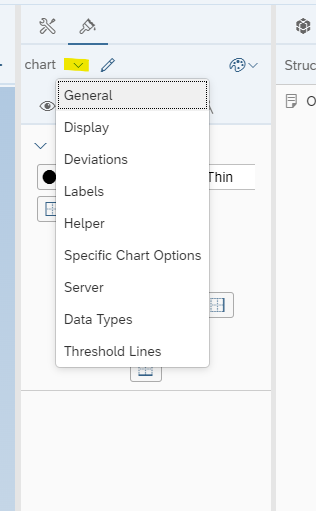
4. Format the chart, the table or the bubble using the formatting from the custom element, which you can find under the formatting tab. Click the arrow to adjust the settings
, multiple selections available,
Related content
Quick Start
Quick Start
More like this
Variables
Variables
More like this
Installation
Installation
More like this
en Quickstart (SAC)
en Quickstart (SAC)
More like this
en Quickstart (TBL)
en Quickstart (TBL)
More like this
en Quickstart PBI (pictograms)
en Quickstart PBI (pictograms)
More like this