en GPS Tab4 Chart Specific (matrix)
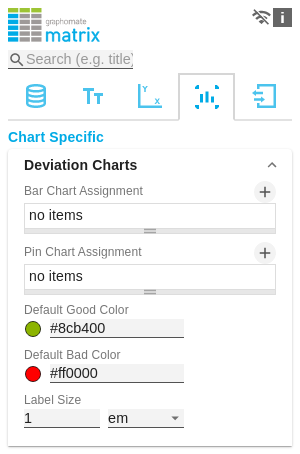
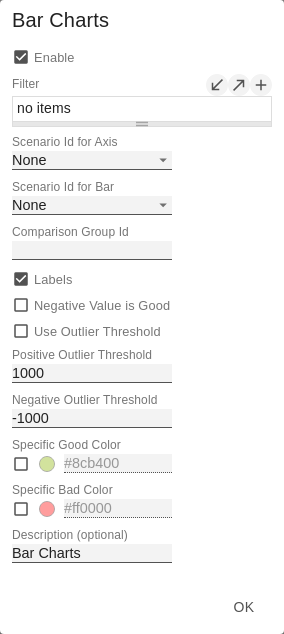
Deviation ChartsIn this tab you configure visual elements like bar or pin charts in the graphomate matrix. Bar Chart AssignmentThis property determines which data should be displayed as an In-Cell Bar Chart type instead of a number. This can be both source data and calculated measures - tab Data: Calculations. This is a list, whereby each individual list element represents an independent configuration. Click on the sign or in the empty list to make settings for the bar charts. Bar Chart Assignment Pop-Up
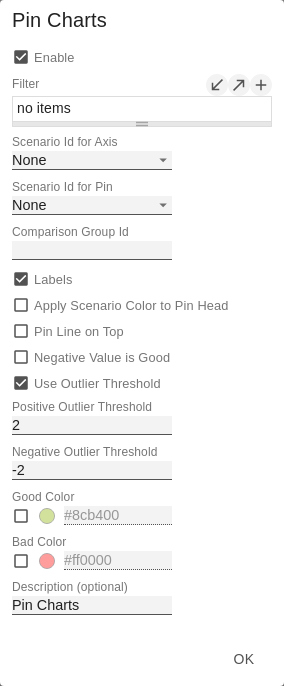
Pin Chart AssignmentThis property determines which data should be displayed as an In-Cell Pin Chart type instead of a number. This can be both source data and calculated measures - tab Data: Calculations. This is a list, whereby each individual list element represents an independent configuration. Click on the sign or in the empty list to make settings for the pin charts. Pin Chart Assignment Pop-Up
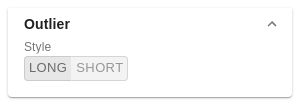
Default Good ColorHere you can set the color for positive connoted values by clicking on the corresponding colored circle to open the color picker. Default Bad ColorHere you can set the colors for negatively connoted values by clicking on the corresponding colored circle to open the color picker. Outlier StyleHere you can select how outliers are displayed. In SHORT mode, the outliers are displayed as small triangles on the axis. In LONG mode, however, the outliers are displayed over the entire available area according to IBCS rules. Label SizeEnter the size of the font in the deviation charts. Choose a CSS unit (such as px, em) from the list. | |
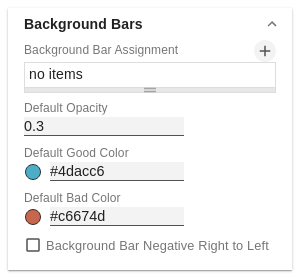
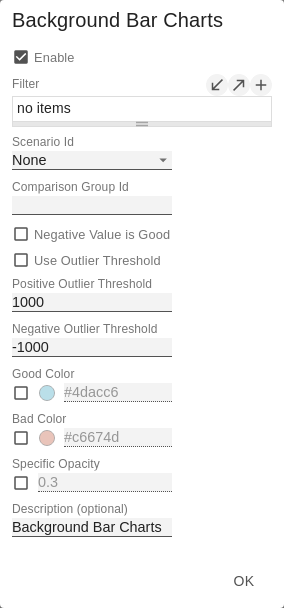
Background BarsBackground Bar AssignmentThis property determines which data should be displayed as an In Cell Background Bar instead of a number. This is a list, whereby each individual list element represents an independent configuration. Click on the sign or in the empty list to make settings for the background bars. Background Bar Assignment Pop-Up
Default OpacityThis value determines to what extent the in-cell bars should be hidden. The value starts at 0.0 (completely hidden) and goes up to 1.0 (completely visible). Values in between make the bars appear semitransparent. Default Good ColorHere you can set the color for positive connoted values of background bar cells by clicking on the corresponding colored circle to open the color picker. Default Bad ColorHere you can set the color for negative connoted values of background bar cells by clicking on the corresponding colored circle to open the color picker. Background Bar Negative Right To LeftIf this property is active, background bars representing a negative value start at the right edge of the cell. | |
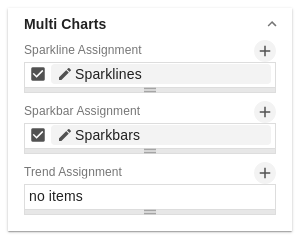
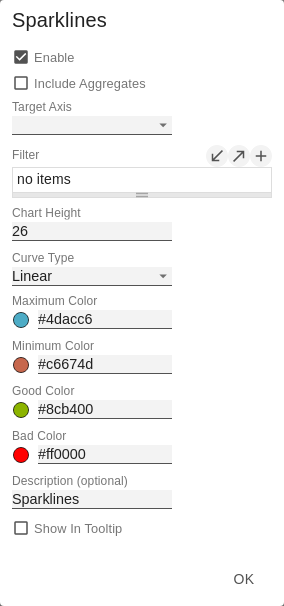
Multi ChartsThis property determines which data should be displayed as a hyper chart in the background instead of a number. This is a list, where each individual element represents an independent configuration. Click on the sign or in the empty list to configure settings for the selected chart type. Sparkline Assignment Pop Up
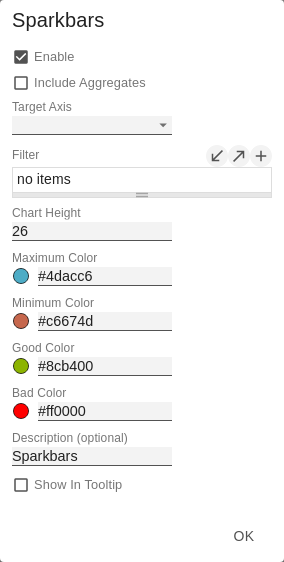
Sparkbar Assignment Pop Up
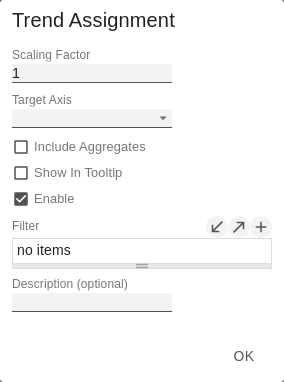
Trend Assignment Pop UpCells can only display one in-cell visualization at a time. It is therefore not possible to integrate other visualization elements in addition to the trend arrows, even if there is room for them.
| |
General ChartingOutlier StyleHere you select how accurately outliers are displayed. In Short mode, the outliers are displayed as small triangles on the axis. In Long mode, on the other hand, the outliers are displayed over the entire available area - in accordance with the rules according to IBCS. |
