en GPS Tab1 Data (matrix) LDE
Data SelectionDataSelect the relevant measures to be displayed in the graphomate matrix by clicking on the symbol. | |
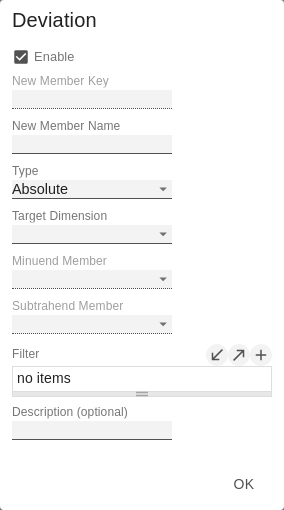
CalculationDeviationsThis property can be used to calculate deviations. It is a list, where each individual item represents the calculation of a new deviation member. The variances are calculated as follows: Absolute: Minuend - Subtrahend Please note: At this point the values for deviations are only calculated. You have the possibility to visualize these calculated values on the tab "Chart Specific". Deviations Pop-UpYou can create new variances using the sign. Each configuration has the following properties:
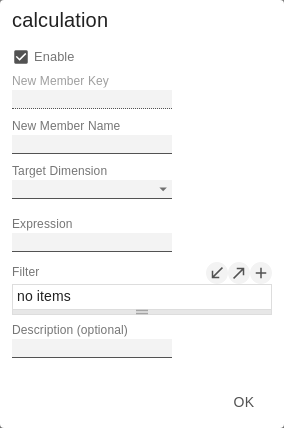
Calculated MembersCalculate additional columns, rows or members using formula input. Calculated Members Pop-UpYou can create new calculated members using the sign. Each configuration has the following properties:
You can find a detailed description of the syntax here
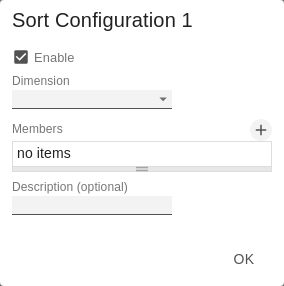
Sort ConfigurationsHere you can sort members of dimensions. Measures are also interpreted as a dimension and can be sorted accordingly. Sort Configurations Pop-upYou can use the sign to create a new sort order for a dimension. Each configuration has the following properties:
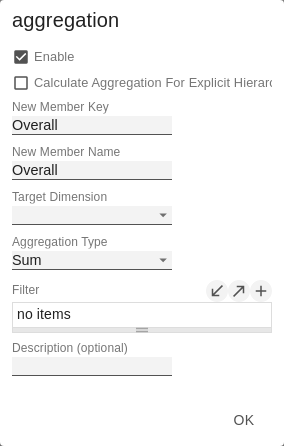
Calculated AggregationYou can create aggregations that differ from the standard for certain dimensions. Use this, for example, to create a different aggregations for each column. Calculated Aggregation Pop-Up
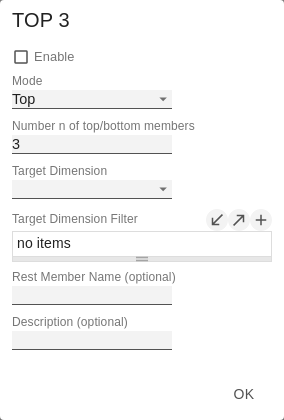
N + RestDefine how many elements should be mapped as Top N or Bottom N with Rest representation. N + Rest Pop-Up (Top 3)You can create new groups for N + rest using the - sign. Each configuration has the following properties:
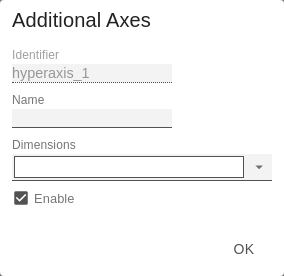
Aggregation TypeThe graphomate matrix calculates aggregations for displaying hierarchy nodes, if the host environment doesn’t provide them. Aggregation Node NameAt this point, a separate name can be assigned to the aggregation elements - e.g. "Sum" or Total" or also "Europe". Following Result NodesChange the position of the totals. Additional Axes (formerly Hyper Axis) ConfigNew hyper axes can be created here. These are additional axes of the data projection (in addition to the known Columns and Rows axes of a normal, two-dimensional projection). This allows multiple data values to be assigned to a cell of the matrix to display in-cell visualizations like sparklines from multiple values. Additional Axes (formerly Hyper Axis) Config Pop UpYou can create new hyper axes using the - sign. Each configuration has the following properties:
| |
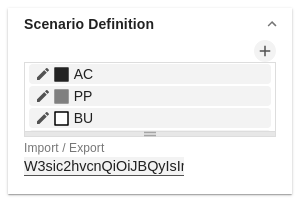
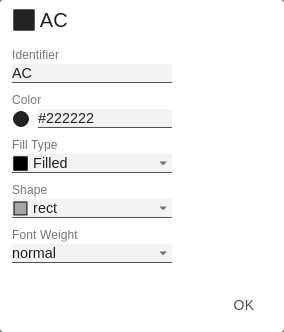
Scenario DefinitionThis property determines the appearance of the scenarios - also known as Data Types. Scenario Definition Pop-UpEach scenario has the following characteristics:
ExportCopy this string to use scenarios in other graphomate components. | |
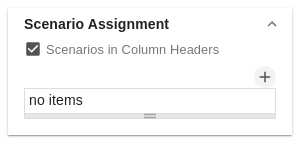
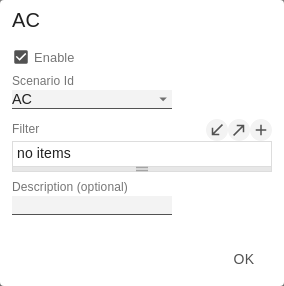
Scenario AssignmentScenarios in Column HeadersThis property ensures that the scenarios are displayed as bars below the column headers. You can use the sign to create assignments of scenarios to dimension members. Scenario Assignment Pop-UpThis property assigns scenarios to data cells. Each configuration has the following properties:
| |
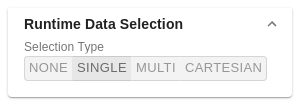
Runtime Data SelectionSelection TypeSpecify how cells can be selected by the user. The following modes are available:
|

