Usage with SAP Analysis for Microsoft Office
- Tim Schauder
- Stefanie Schröder (Unlicensed)
- Jonas Volger (Unlicensed)
- Konradin Schoemers (Unlicensed)
Bind chart to Analysis range
Since version 1.4 it is possible to bind a chart to an Analysis crosstab. This binds the columns of the crosstab to the series and if the count of cells changes, the series length gets adjusted automatically.
To use this functionality, please select a chart and then press the button Bind Analysis Range in the ribbon group Analysis Tools. A window will be shown, where you can select a named range provided by Analysis.
Pressing the button Unbind Analysis Range disables the automatic range selection - though the series will still be bound to cells.
The ribbon menu group Analysis Tools will only be shown, if you have SAP Analysis for Microsoft Office installed. If it is not shown, despite having SAP Analysis for Microsoft Office installed, it can be forced to be displayed by setting the system environment variable GRAPHOMATE_AFO_OPTIONS to the value of "1".
Automation of data updates with SAP Analysis for Mircrosoft Office
Since SAP Analysis deactivates data update events in Excel for technical reasons, you have to use VBA as a workaround to have automatic updates with new data from SAP Analysis. Otherwise charts will not be redrawn, when SAP Analysis writes new data to Excel cells. Since version 1.4 we created the necessary VBA scripts automatically.
But because this caused problems for some users, we changed the mechanics to a manual activation. From now on, for each single workbook the option Enable Analysis Callback in the menu Workbook Settings has to be checked, if the automatic Analysis callback ought to be used. For this to work, there has to exist a VBA script inside the workbook, which can be added manually by pressing the button Add Analysis Callback Script - or which will be added when activating this callback.
If the Analysis callback is active, is shown in the ribbon menu group Analysis Update.
If graphomate charts for Excel are used alongside SAP Analysis for Microsoft Office (AO), please take into account the following guidelines:
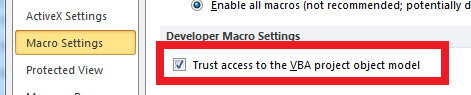
- Important: Please make sure that the option „Trust access to the VBA project object model" under File > Options > Trust Center > Trust Center Settings > Macro Settings is enabled. Otherwise, graphomate charts won't be refreshed automatically when working with Analysis for Microsoft Office.
- Please start AO first, and open the Excel file to be edited only after that. Also, please close the workbook before exiting Excel. Macro warnings during closing can be ignored; the workbook is saved as .xslx without problems.
- graphomate charts for Excel only support SAP Analysis for Microsoft Office 2.0SP4 and later versions; earlier versions of AO are not supported.